
Let's get started with a demo
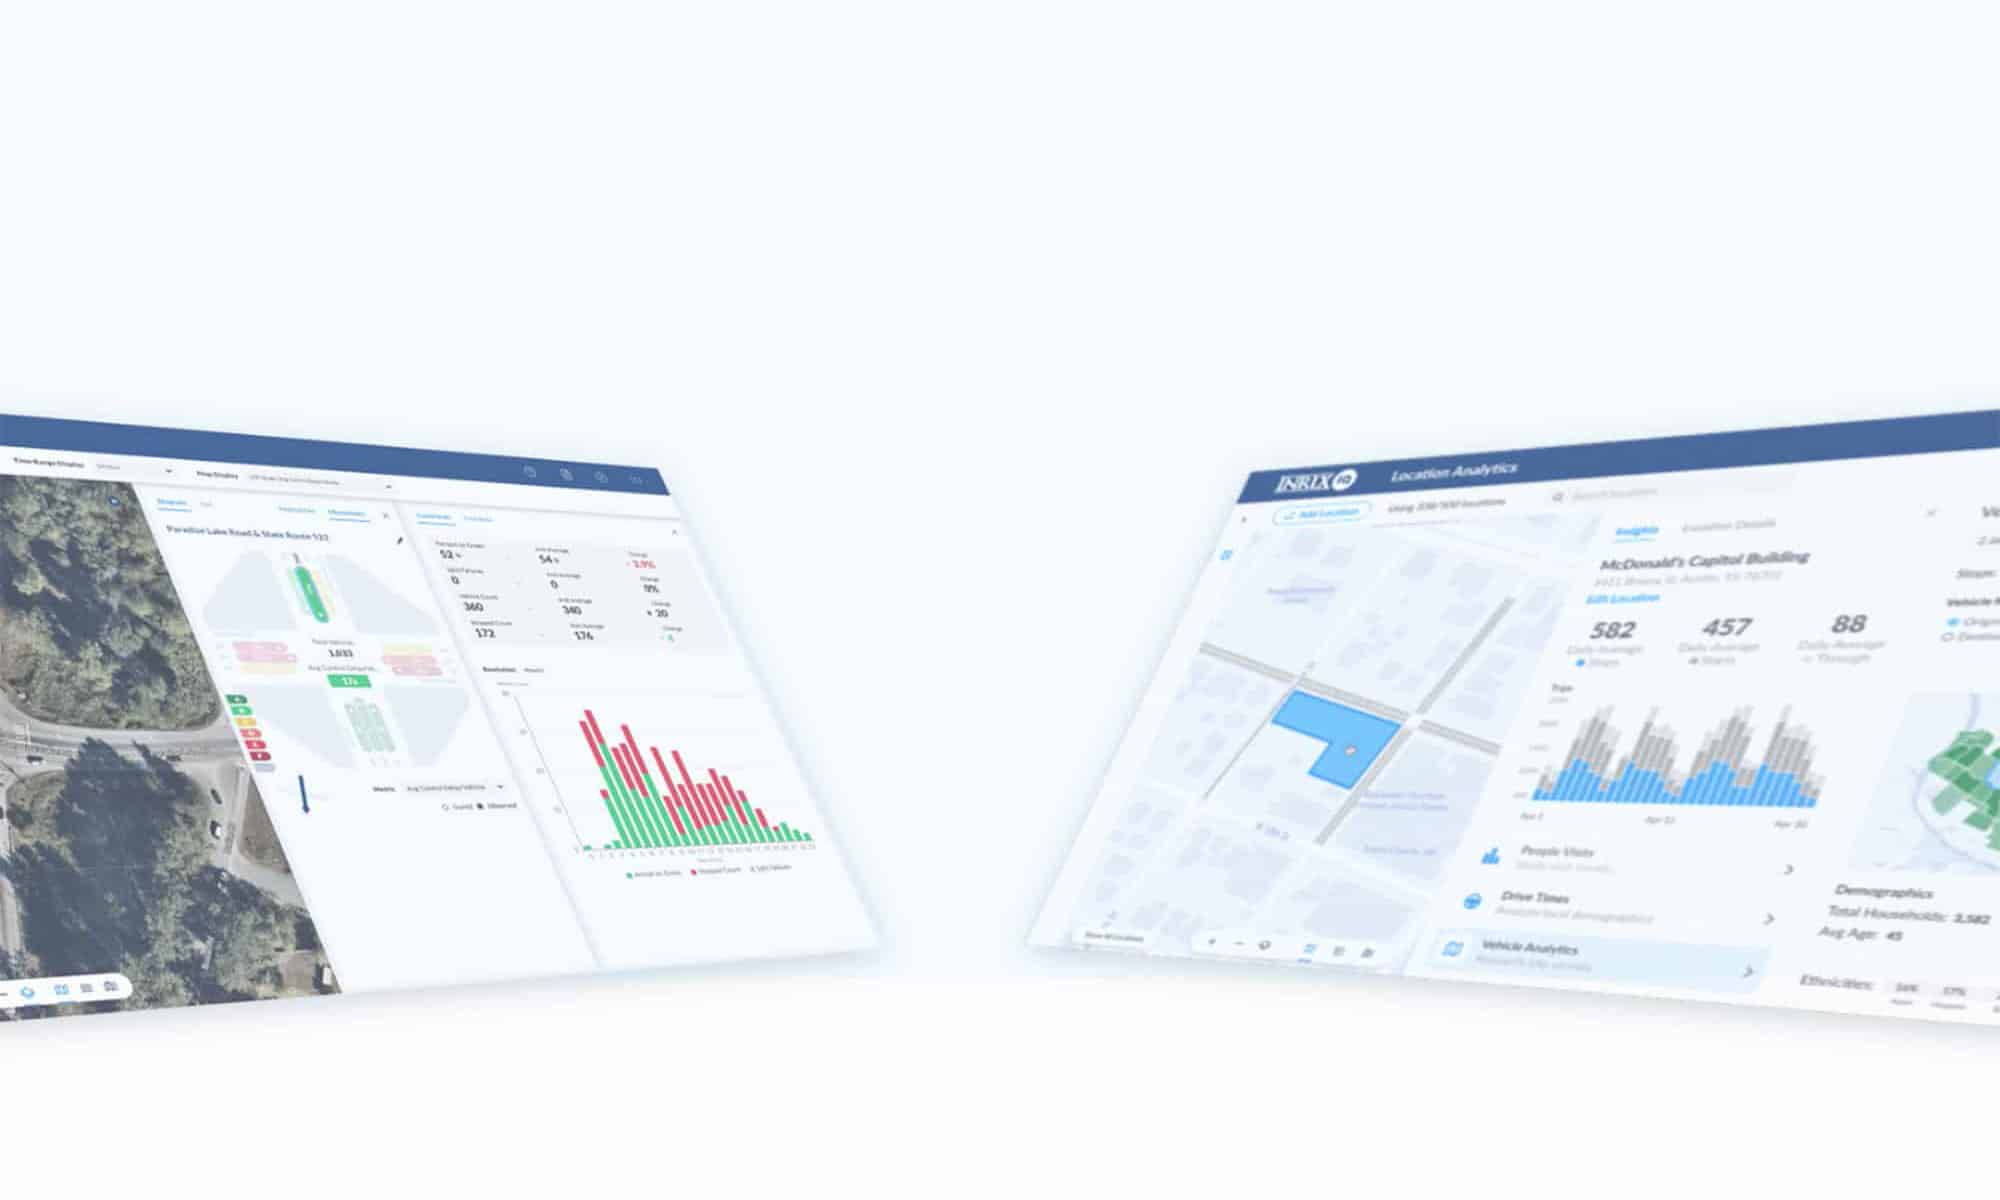
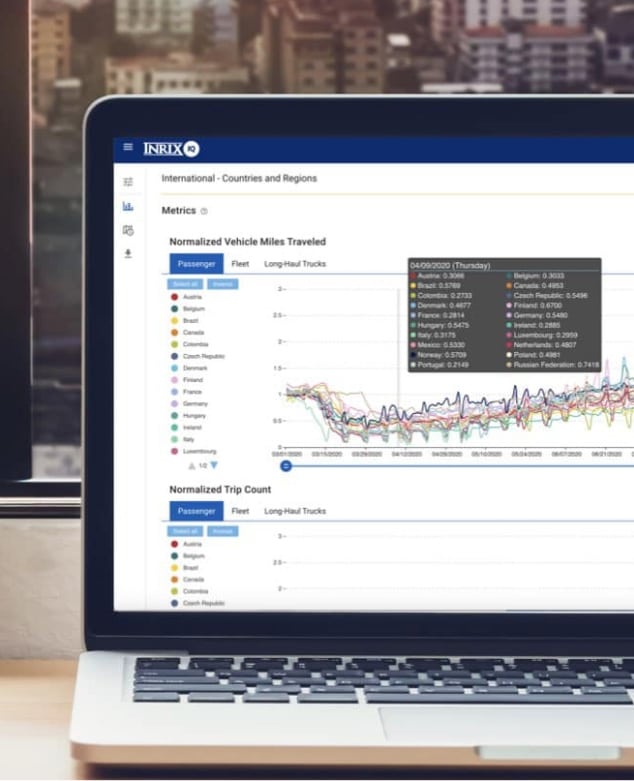
See our mobility intelligence solutions in action to learn how we can save you time, money, and stress.
Find out why the world's most innovative organizations rely on INRIX data and insights


During Your Demo
Tell us about the challenges you’re facing and our INRIX expert will show you all of the ways that we can help.
Afterwards, we’ll put together a personalized recommendation of INRIX solutions that can best help you solve them.
See how INRIX is helping
our customers shape the future of mobility.

“We have found the INRIX mobility data set to be a much more predictive data set than traditional, more old school methods when we are looking at who our customers are, where they are coming from and when.”
Jeff RubinoVP of Real Estate

“Through its collaboration with INRIX, the BMW Group aims to continue setting the benchmark in urban mobility into the future.”
Martin HauschildHead of Mobility Technologies

“With INRIX Roadway Analytics, we’re taking the necessary steps to maximize our efforts to move people and goods through our city.”
Tim FremauxTransportation Engineer LADOT
Our mission is to keep the world moving smarter, safer, and greener.
Let’s shape the future of mobility together.
Get My Free Demo