WASHINGTON, DC – December 11, 2023 – AAA projects 115.2 million travelers will head 50 miles or more from home over the 10-day year-end holiday travel period*. This year’s total number of domestic travelers is a 2.2% increase over last year and the second highest year-end travel forecast since 2000, when AAA began tracking holiday travel. 2019 remains the busiest Christmas and New Year’s travel period on record with 119 million travelers.
“This year-end holiday forecast, with an additional 2.5 million travelers compared to last year, mirrors what AAA Travel has been observing throughout 2023,” said Paula Twidale, Senior Vice President of AAA Travel. “More Americans are investing in travel, despite the cost, to make memories with loved ones and experience new places.”
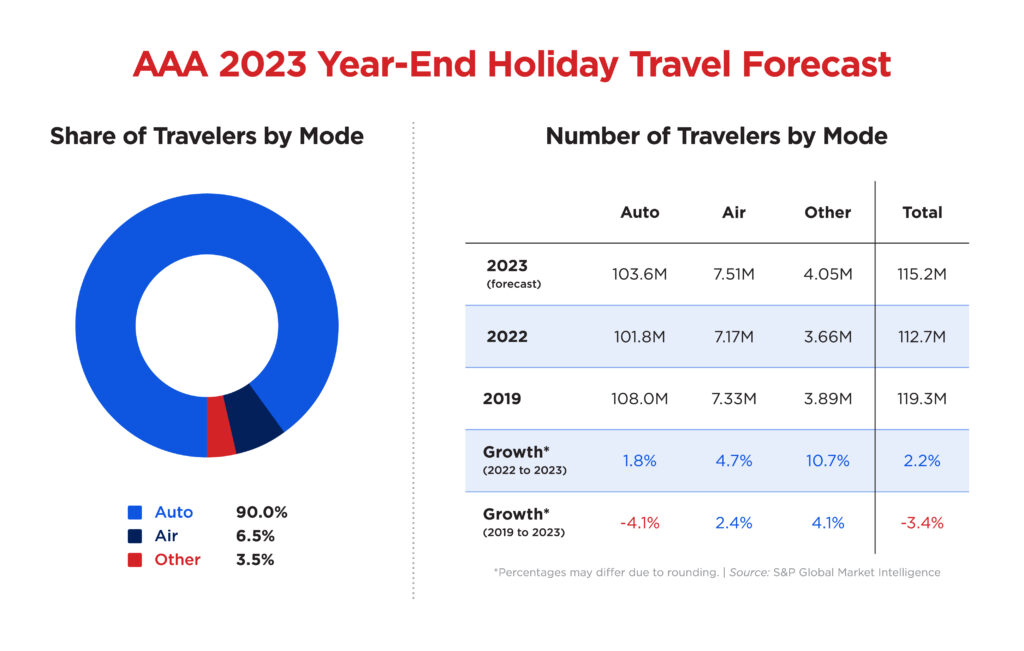 AAA expects nearly 104 million people will drive to their holiday destinations, an increase of 1.8% compared to 2022. This year’s projected number of drivers is the second highest on record after 2019 when 108 million drivers hit the road for the holidays. As 2023 comes to a close, drivers can expect to pay about the same or less for a gallon of gas than they did last holiday season, when the national average on Christmas Day and New Year’s Day was $3.10 and $3.20 respectively.
Airports are expected to be the busiest they’ve ever been over the Christmas and New Year’s travel period. AAA projects 7.5 million air travelers this holiday season, surpassing 2019’s record of 7.3 million passengers. Average ticket prices are slightly lower than last year. According to AAA booking data, the average price for a roundtrip ticket to Orlando this holiday season is $613, down from $735 last year. A roundtrip ticket to Las Vegas is $508 now compared to $705 in 2022. “It depends on your desired route and destination. There are last-minute deals to be found, but if your preference is a nonstop flight with seat selection, AAA recommends booking well in advance and protecting your investment with travel insurance,” Twidale added.
The number of people traveling by other modes, like bus, train, and cruise, is projected to surpass 2019. AAA expects more than 4 million Americans will take alternative transportation over Christmas and New Year’s compared to 3.66 million in 2022 and 3.89 million in 2019. Demand for cruises has skyrocketed post-pandemic, and the industry is now preparing for the wave of bookings that traditionally happens at the start of the new year. “Savvy travelers know that right after the holidays is the best time to book a cruise,” Twidale said. “That’s when cruise lines offer some of the best deals, and AAA members get exclusive benefits in addition to those discounts.”
Best/Worst Times to Drive and Peak Congestion by Metro
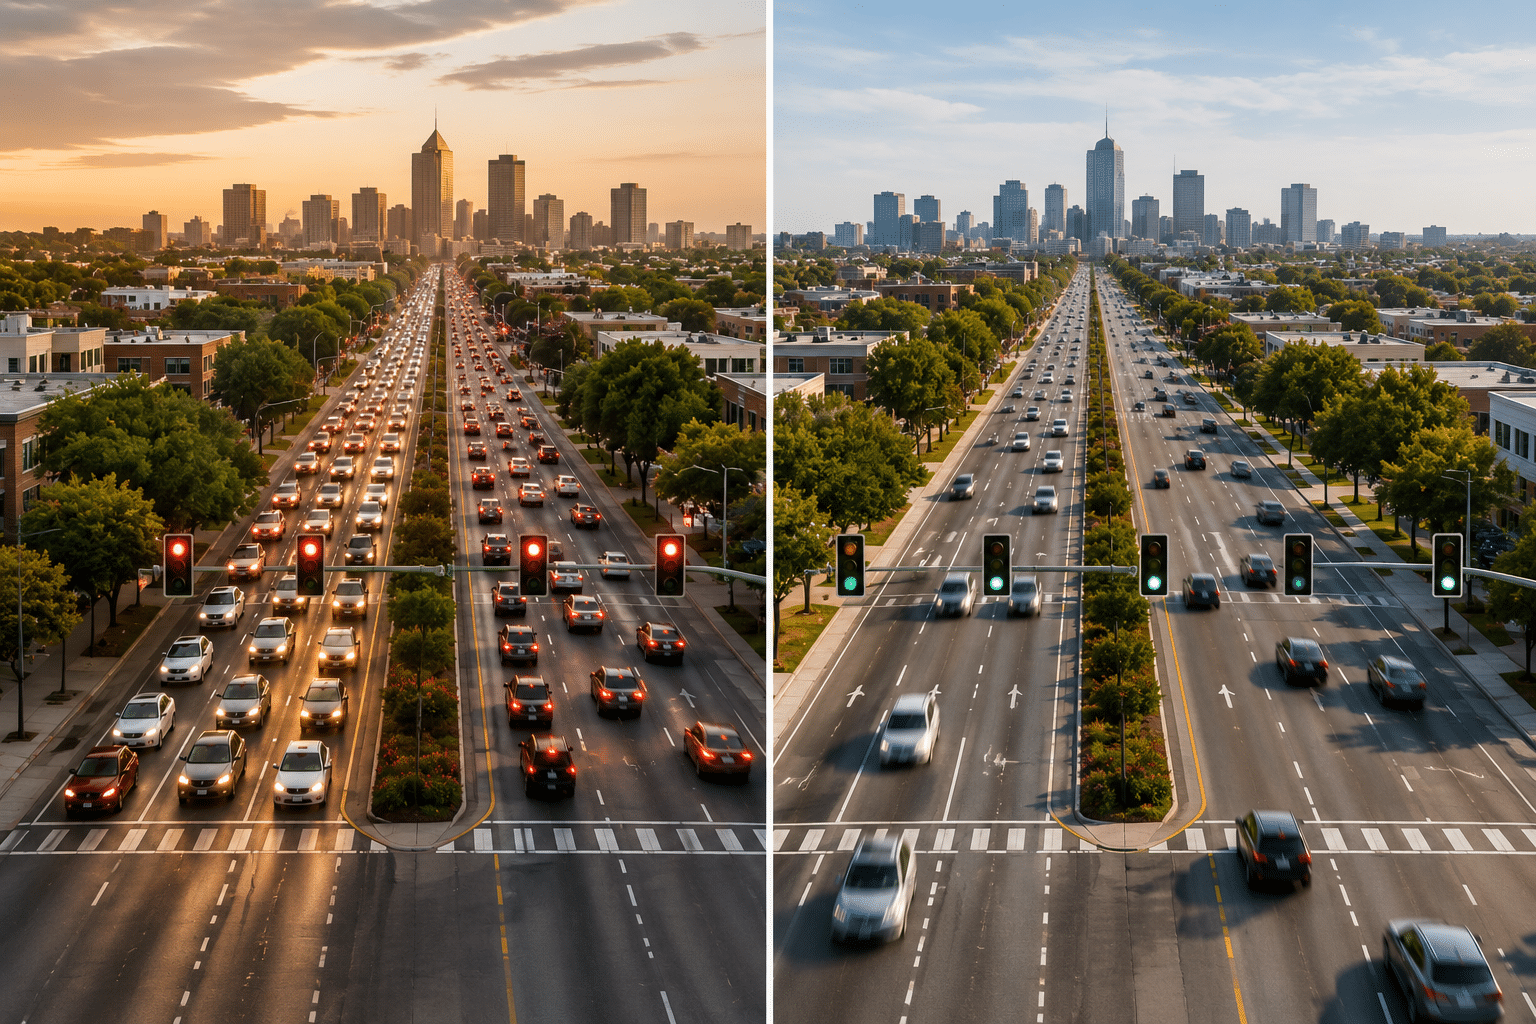
INRIX, a provider of transportation data and insights, says there will be several days of potentially bad traffic during the 10-day holiday period. Saturday, December 23, and Thursday, December 28, will be the most congested days on the road. INRIX also says Saturday, December 30, when many people will be heading back home from their holiday destinations or traveling for New Year’s Eve, will see an increase in traffic compared to a normal Saturday. The best times to hit the road are before lunchtime or after 7pm.
“Nationwide, drivers could see travel times up to 20% longer this holiday season. In major metros, especially in Denver, Minneapolis, and Washington, DC, drivers could experience nearly double the typical delays,” said Bob Pishue, transportation analyst at INRIX. “Avoid peak commuting hours and use traffic apps, local DOT notifications, and 511 services to minimize holiday travel traffic frustrations.”
Please note that the times listed below are for the time zone in which the metro is located.
For example, Atlanta routes = ET and Los Angeles routes = PT
| BEST & WORST TIMES TO TRAVEL BY CAR | |||||||
| Date | Worst Travel Time | Best Travel Time | |||||
| Saturday, Dec 23 | 11:00 AM – 7:00 PM | Before 10:00 AM | |||||
| Sunday, Dec 24 | Minimal Traffic Impact Expected | ||||||
| Monday, Dec 25 | Minimal Traffic Impact Expected | ||||||
| Tuesday, Dec 26 | 1:00 – 5:00 PM | Before 12:00 PM | |||||
| Wednesday, Dec 27 | 1:00 – 7:00 PM | Before 12:00 PM | |||||
| Thursday, Dec 28 | 2:00 – 8:00 PM | Before 12:00 PM | |||||
| Friday, Dec 29 | 2:00 – 8:00 PM | Before 12:00 PM | |||||
| Saturday, Dec 30 | 5:00 – 7:00 PM | Before 12:00 PM | |||||
| Sunday, Dec 31 | Minimal Traffic Impact Expected | ||||||
| Monday, Jan 01 | Minimal Traffic Impact Expected | ||||||
|
PEAK CONGESTION BY METRO |
|||||||
| Metro | Route | Peak Congestion Period | Est. Travel Time | Compared to Typical | |||
| Atlanta | Augusta to Atlanta via I-20 W | Monday 12/30, 7:15 PM | 1 hour 56 minutes | 23% | |||
| Boston | Boston to Portsmouth via I-95 N | Saturday 12/23, 4:15 PM | 1 hour 41 minutes | 55% | |||
| Chicago | Milwaukee to Chicago via I-94 E | Thursday 12/28, 5:30 PM | 1 hour 47 minutes | 29% | |||
| Denver | Fort Collins to Denver via I-25 S | Friday 12/29, 2:00 PM | 1 hour 40 minutes | 67% | |||
| Detroit | Detroit to Cleveland via I-75 S | Saturday 12/23, 6:45 PM | 3 hours 18 minutes | 27% | |||
| Houston | Houston to Galveston via I-45 S | Saturday 12/23, 5:15 PM | 1 hours 6 minutes | 38% | |||
| Los Angeles | Bakersfield to Los Angeles via I-5 S | Wednesday 12/27, 6:15 PM | 2 hours 41 minutes | 50% | |||
| Minneapolis | Eau Claire to Minneapolis via I-94 W | Thursday 12/28, 10:15 AM | 2 hours 7 minutes | 62% | |||
| New York | New York to Hamptons via Long Island Expy E | Saturday 12/23, 2:30 PM | 2 hours 8 minutes | 50% | |||
| Portland | Portland to Hood River via I-84 E | Saturday 12/23, 5:45 PM | 1 hour 39 minutes | 40% | |||
| San Diego | San Diego to Palm Springs via I-15 N | Saturday 12/23, 5:00 PM | 2 hours 50 minutes | 22% | |||
| San Francisco | San Francisco to Sacramento via I-80 E | Saturday 12/23, 5:15 PM | 1 hour 49 minutes | 73% | |||
| Seattle | Seattle to Bellingham via I-5 N | Wednesday 12/27, 6:45 PM | 2 hours 33 minutes | 47% | |||
| Tampa | Tampa to Orlando via I-4 E | Tuesday 12/26, 4:15 PM | 2 hours 59 minutes | 58% | |||
| Washington, DC | Baltimore to Washington DC via Balt/Wash Pkwy S | Friday 12/29, 3:45 PM | 1 hour 1 minute | 67% | |||
Source: INRIX
Top Year-End Holiday Destinations
This holiday season, many travelers are heading to warm weather destinations like Florida and the Caribbean, tourist hotspots like New York and Las Vegas, and European cities like London and Rome. Here are top domestic and international destinations, based on AAA flight booking data.
| DOMESTIC | INTERNATIONAL/U.S. TERRITORIES |
| Orlando, FL | London, England |
| Anaheim, CA | St. Thomas, U.S. Virgin Islands |
| Chicago, IL | Aruba |
| Charlotte, NC | Dublin, Ireland |
| Miami, FL | Toronto, Ontario, Canada |
| Atlanta, GA | Rome, Italy |
| Las Vegas, NV | Reykjavík, Iceland |
| New York, NY | San Juan, Puerto Rico |
| Phoenix, AZ | Montego Bay, Jamaica |
| Houston, TX | Costa Rica |
Airport Parking Tips
With a record number of air travelers expected this holiday season, AAA recommends travelers plan ahead and take precautions when driving to the airport and parking their vehicles.
- Reserve a parking spot ahead of time to save time and money.
- Choose a well-lit, secure garage.
- On-site garages tend to be more expensive but offer convenience and peace of mind given their proximity to the terminals.
- If choosing off-site parking, look for reputable businesses like The Parking Spot which is securely fenced and offers a shuttle to the airport (AAA members get a discount).
- Opt for covered parking, if you live in an area expecting inclement weather.
- Remove valuables from your vehicle.
- Lock doors and roll up windows.
- Take a photo of your spot to remember where you parked.
- Keep your ticket – and receipt, if you prepaid – handy to show when exiting.
Holiday Forecast Methodology
Travel Forecast
In cooperation with AAA, S&P Global Market Intelligence developed a unique methodology to forecast actual domestic travel volumes. The economic variables used to forecast travel for the current holiday are leveraged from S&P Global Market Intelligence’s proprietary databases. These data include macroeconomic drivers such as employment, output, household net worth, asset prices including stock indices, interest rates, housing market indicators, and variables related to travel and tourism including gasoline prices, airline travel, and hotel stays. AAA and S&P Global Market Intelligence have quantified holiday travel volumes going back to 2000.
Historical travel volume estimates come from DK SHIFFLET’s TRAVEL PERFORMANCE/MonitorSM. The PERFORMANCE/MonitorSM is a comprehensive study measuring the travel behavior of U.S. residents. DK SHIFFLET contacts over 50,000 U.S. households each month to obtain detailed travel data, resulting in the unique ability to estimate visitor volume and spending, identify trends, and forecast U.S. travel behavior, all after the trips have been taken.
The travel forecast is reported in person-trips. In particular, AAA and SPGMI forecast the total U.S. holiday travel volume and expected mode of transportation. The travel forecast presented in this report was prepared the week of October 9, 2023.
*Year-End Holiday Travel Period
For the purposes of this forecast, the year-end holiday travel period is defined as the 10-day period from Saturday, December 23, 2023 to Monday, January 1, 2024.
###