INRIX Safety Analytics
Achieve Your Safety Goals with Data-Driven Insights

INRIX Safety Analytics provides powerful insights about roadways to help improve safety for all road users.
Many cities still rely on outdated tools, fragmented data, and manual analysis to guide their safety efforts — slowing progress and making it difficult to act with urgency. Meeting Vision Zero and Safe Streets goals requires a smarter, faster, and more proactive approach.
INRIX Safety Analytics empowers transportation professionals with the tools and insights needed to reduce crashes, protect vulnerable road users, and accelerate progress toward Vision Zero and Safe Streets goals.
Built on INRIX’s deep transportation expertise and diverse proprietary datasets, INRIX Safety Analytics offers unmatched visibility into crash hotspots, exposure risks, and safety trends — helping agencies make proactive, evidence-based decisions.
Safety Analytics will be available soon on INRIX IQ. Sign up if you'd like to learn more.
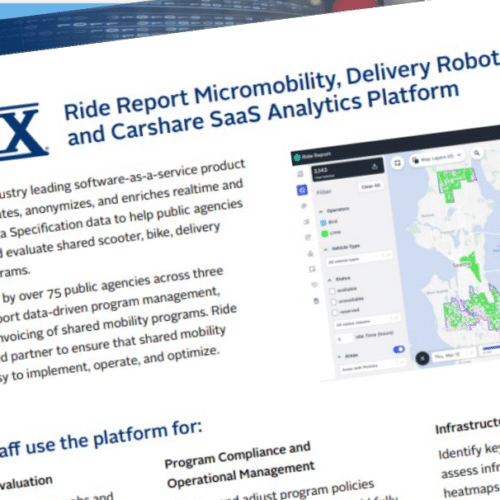
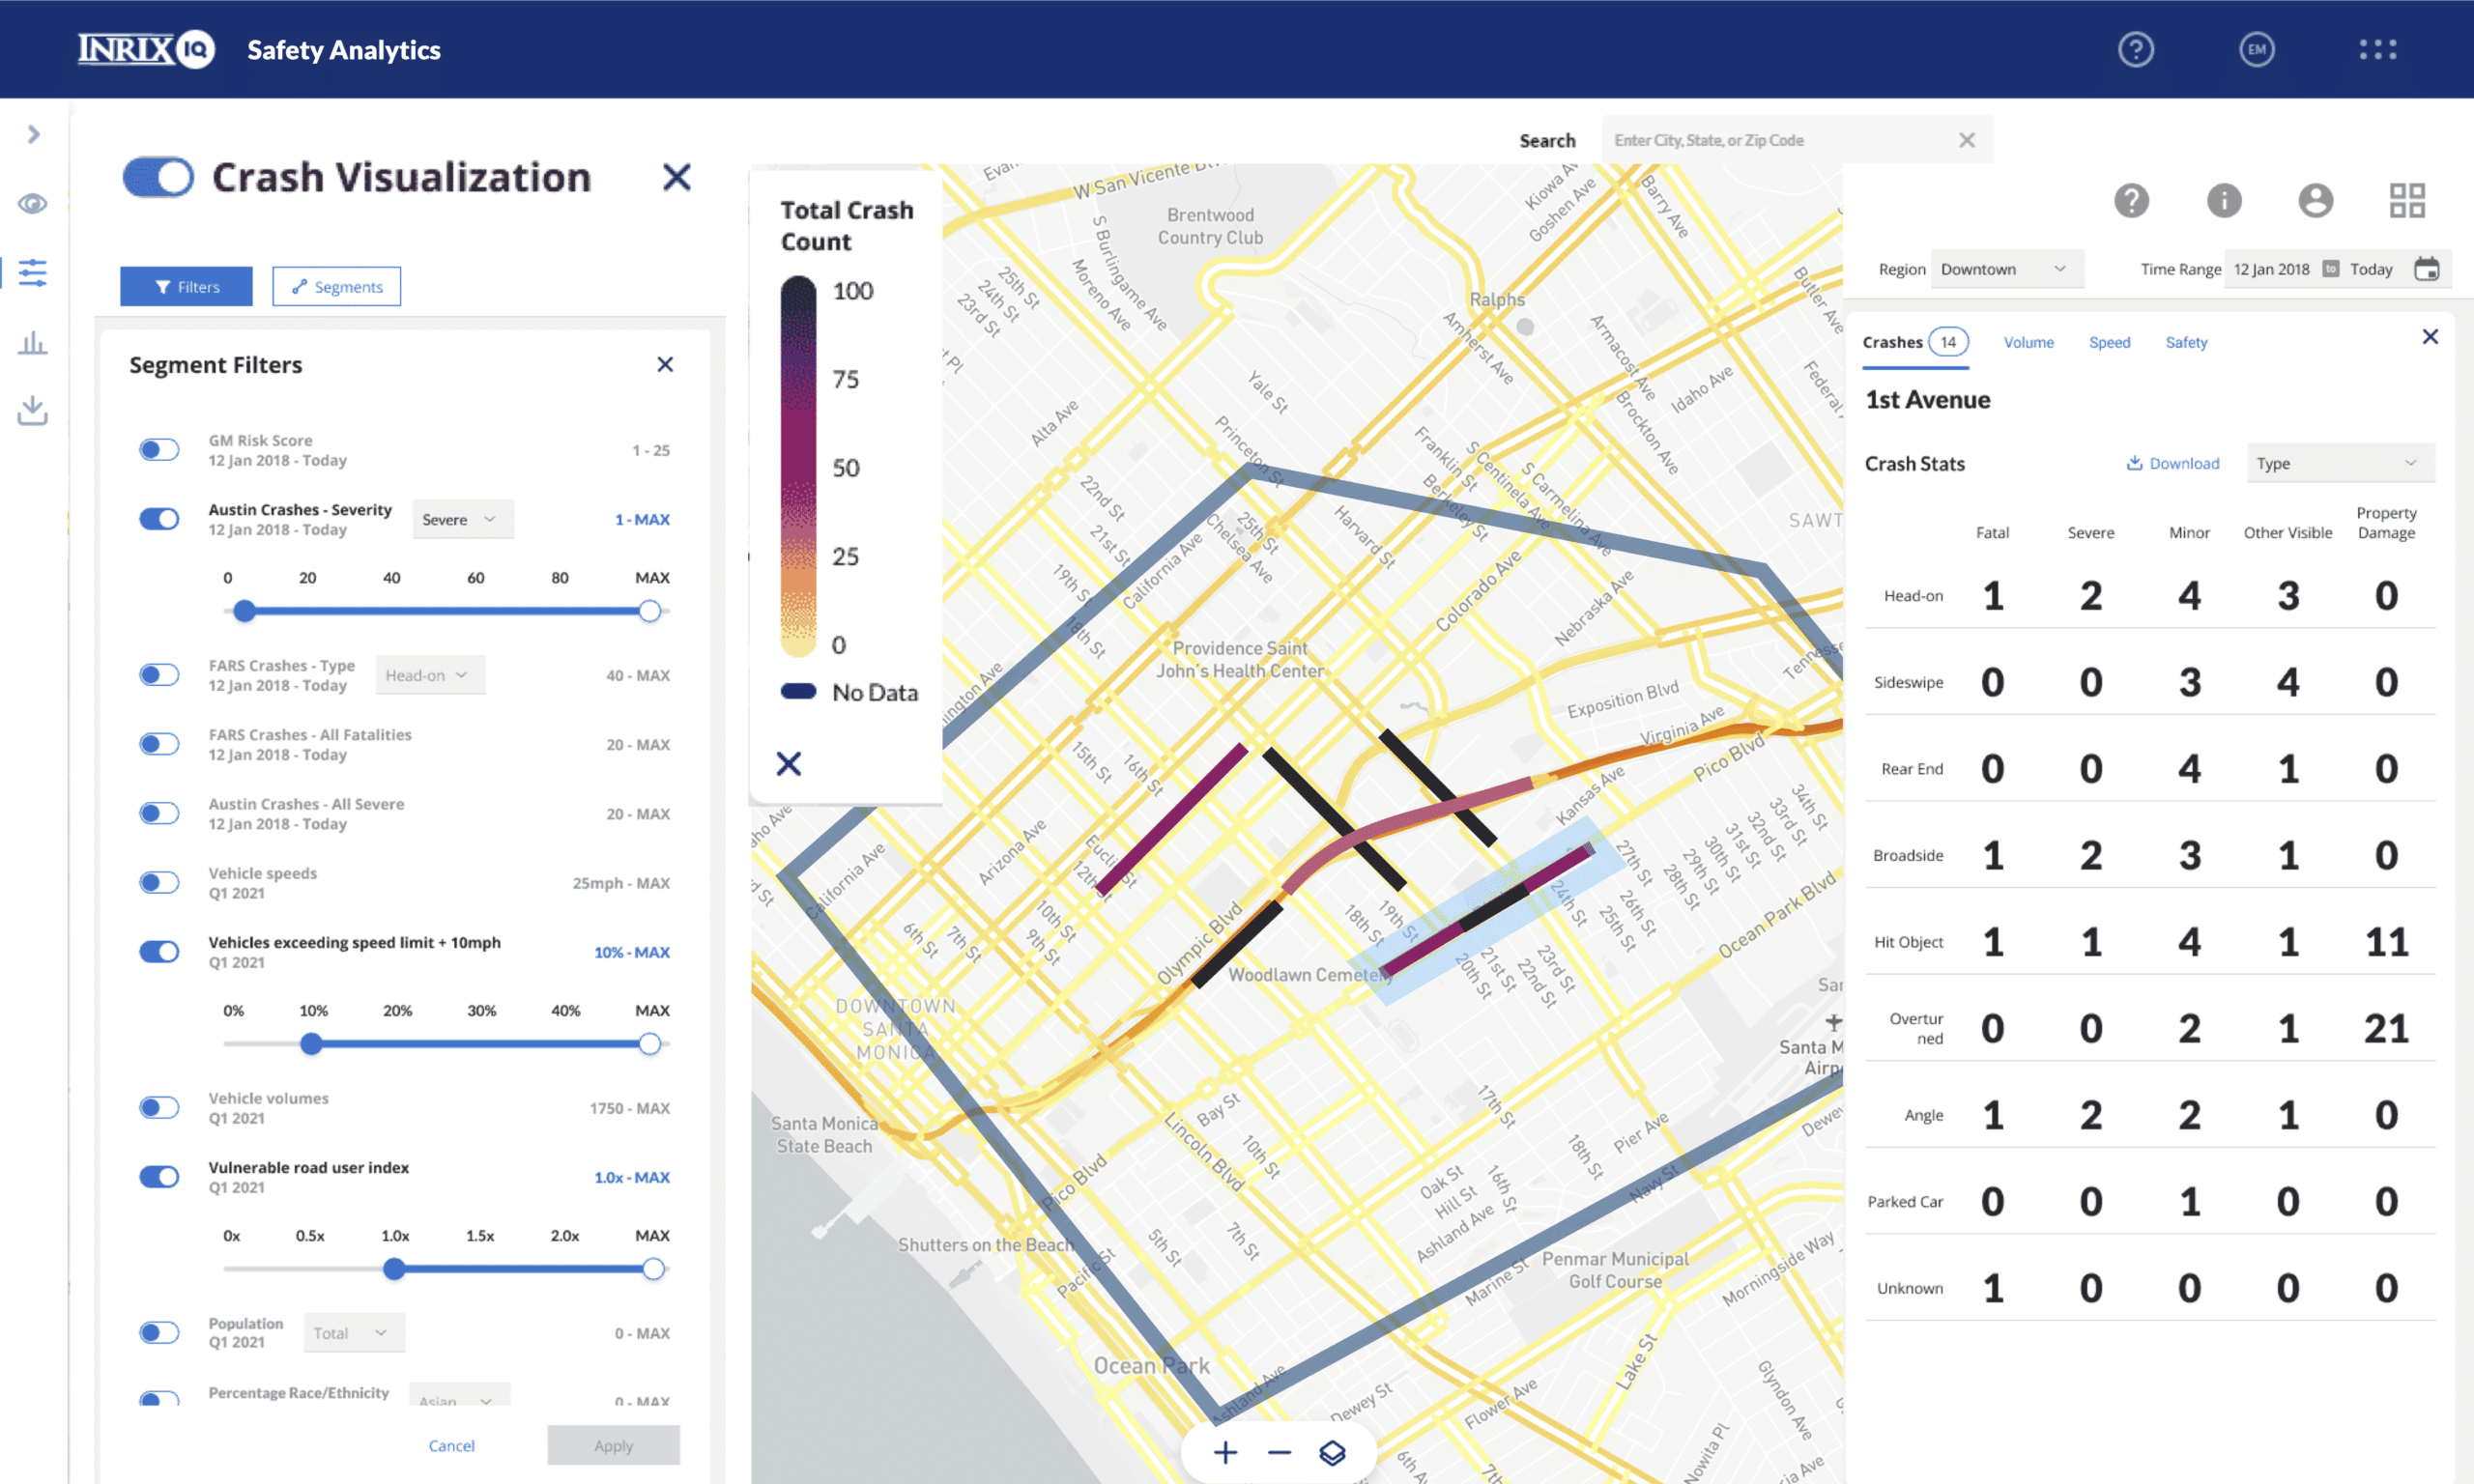
Access critical safety and demographic datasets in one cloud-based application
Safety Analytics is pre-loaded with the movement, safety, and demographic datasets to help view safety though the lens of equity, and lets you import your own local data.
Identify and assess risk factors for all roadway segments
Safety Analytics provides sophisticated yet easy-to-use visual analysis tools that help you identify relative risk at the roadway segment level, gain valuable insights, and prioritize those segments that need the most attention.
Evaluate the impact of safety projects with access to near real-time insights
The speed, volumes, risk score, VRU, and demographic data in Safety Analytics are updated regularly. Don’t wait for the next funding cycle before understanding the impacts of the safety measures you have implemented.
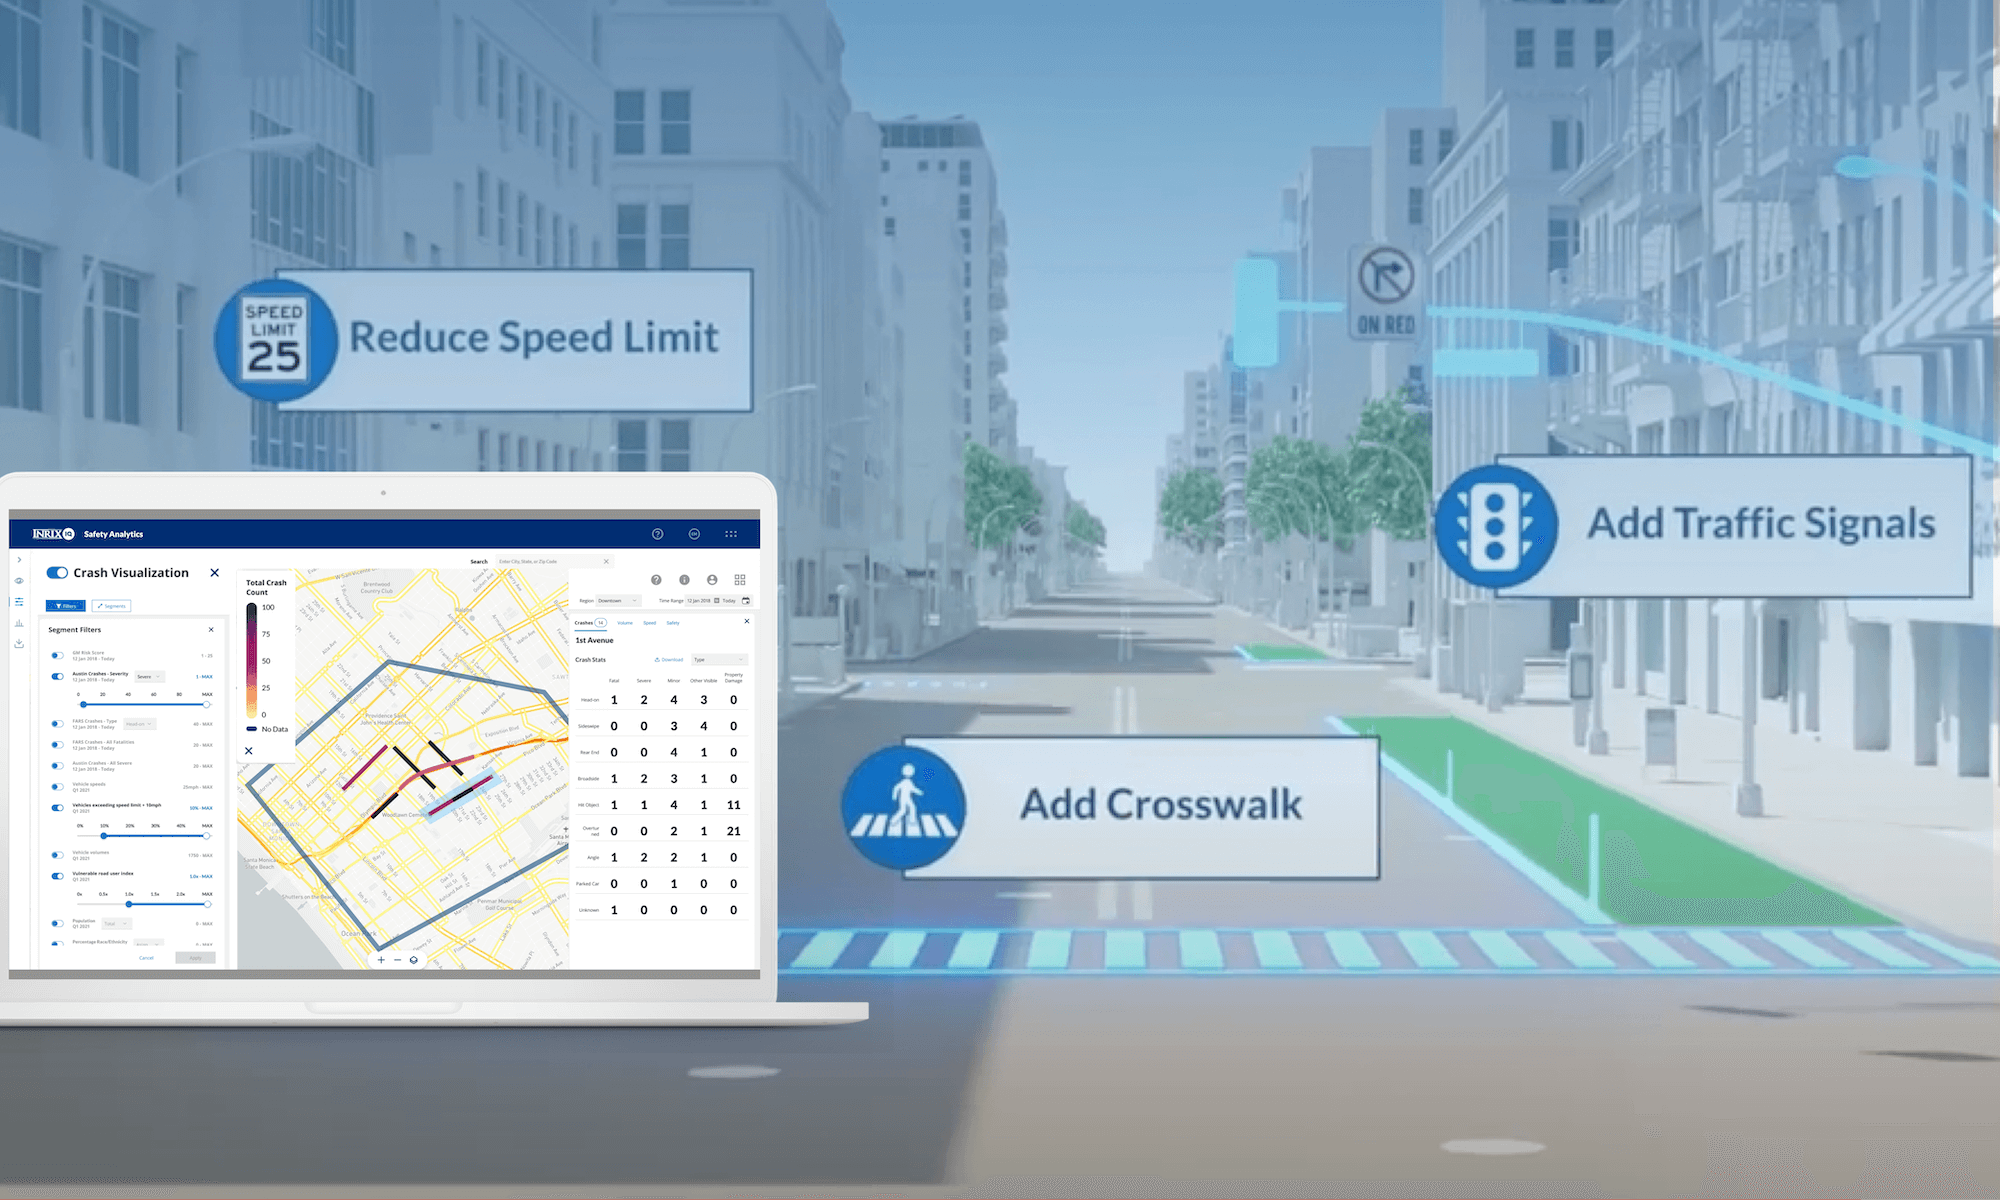
Assess Risk Across All Roadways Segments
FARS & Agency Crash Data
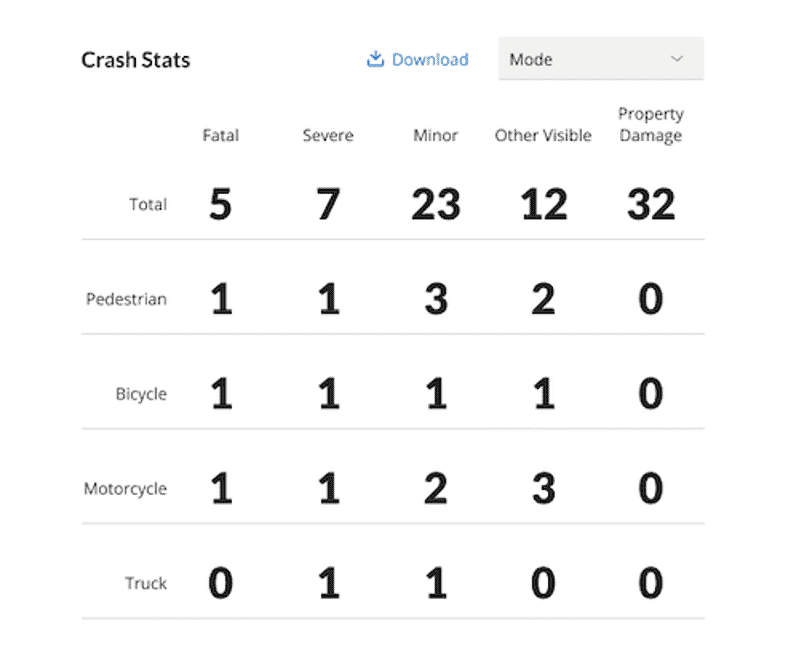
Fatalities data with crash mode, severity, type, and contributing factors help identify roadway segments that may need attention.
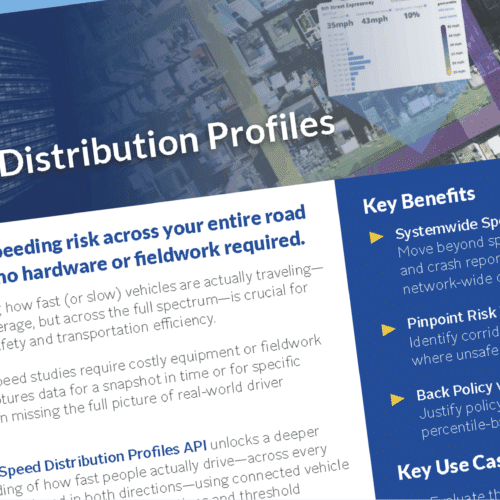
Speed Distribution Profile
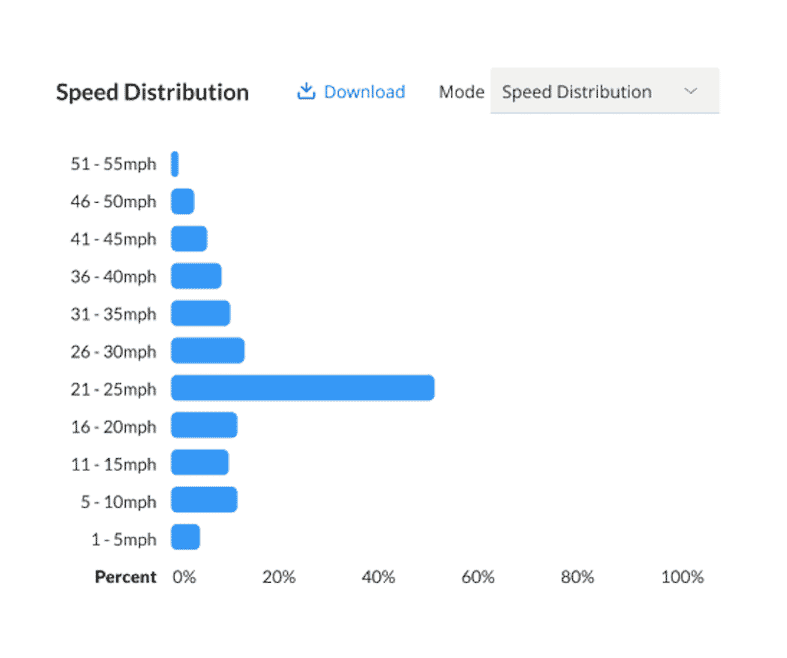
A vehicle speed breakdown by time of day for roadway segments helps you analyze how speeds may be contributing to crash rates.
Traffic Volumes
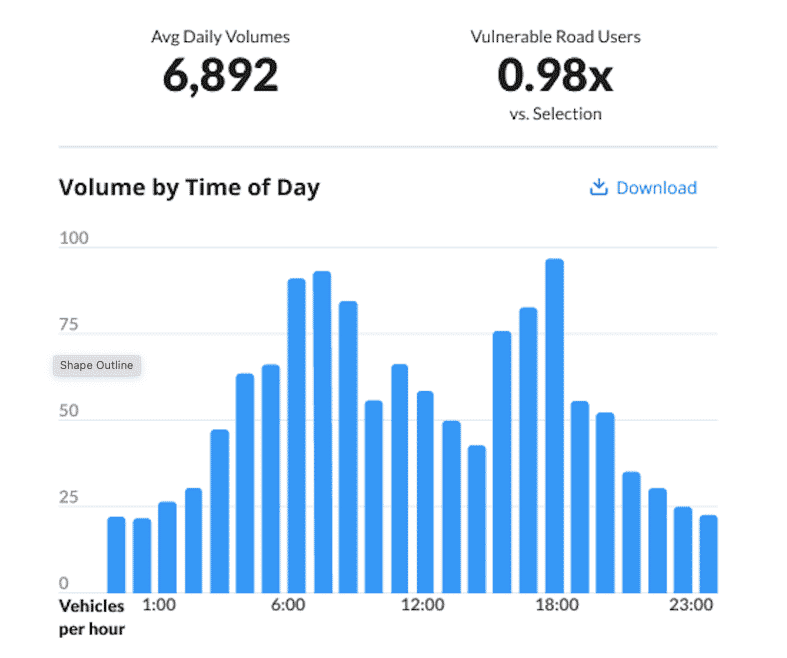
Peak-hour traffic information helps compare crash data with congested roadway segments with link-level volume profiles.
Vulnerable Road User Index
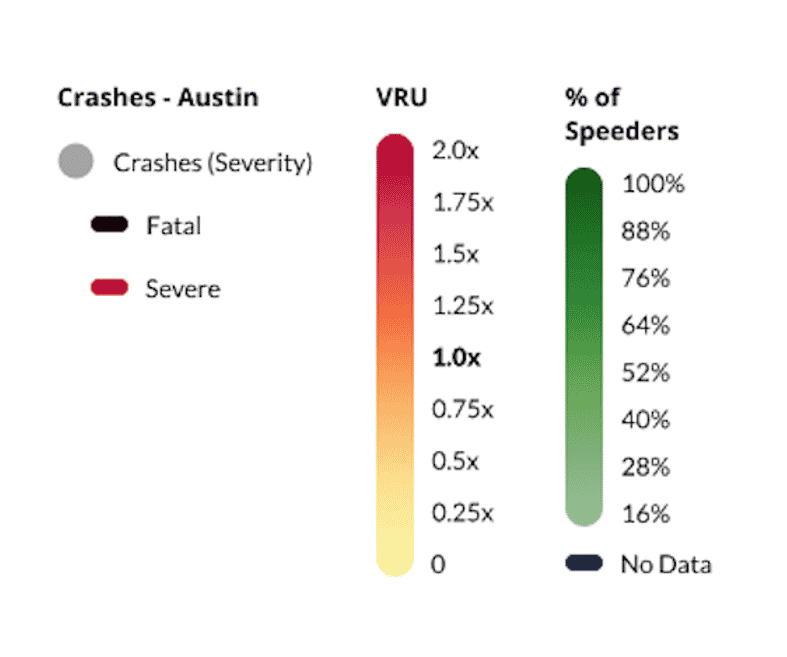
The relative presence of vulnerable road users moving in a given area helps compare roadway segments based on VRU activity.
Demographic Data
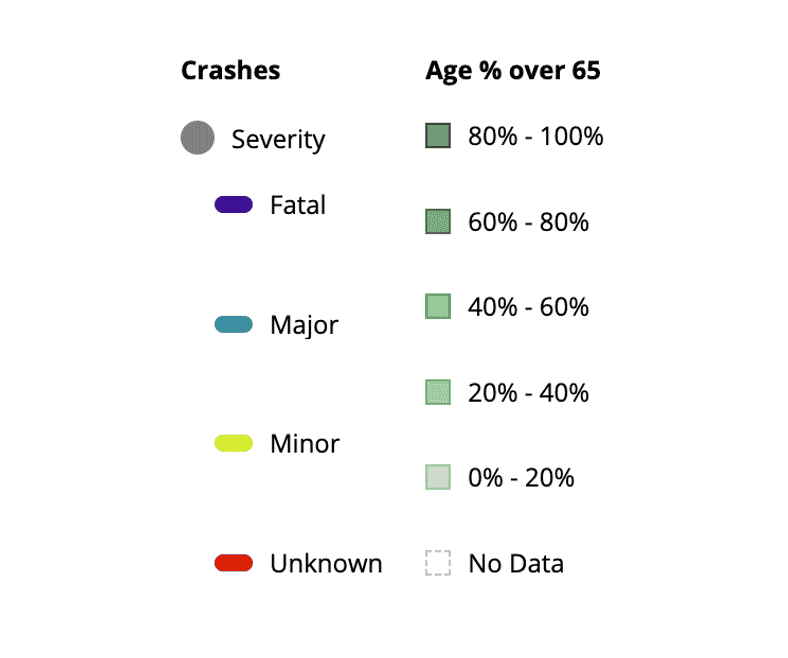
Census block group level demographic data can help practitioners start to understand the road network through an equity lens by comparing crash data with US Census information.
Intuitive Tools That Make It Easier to Create Effective Safety Plans
GET A HOLISTIC VIEW
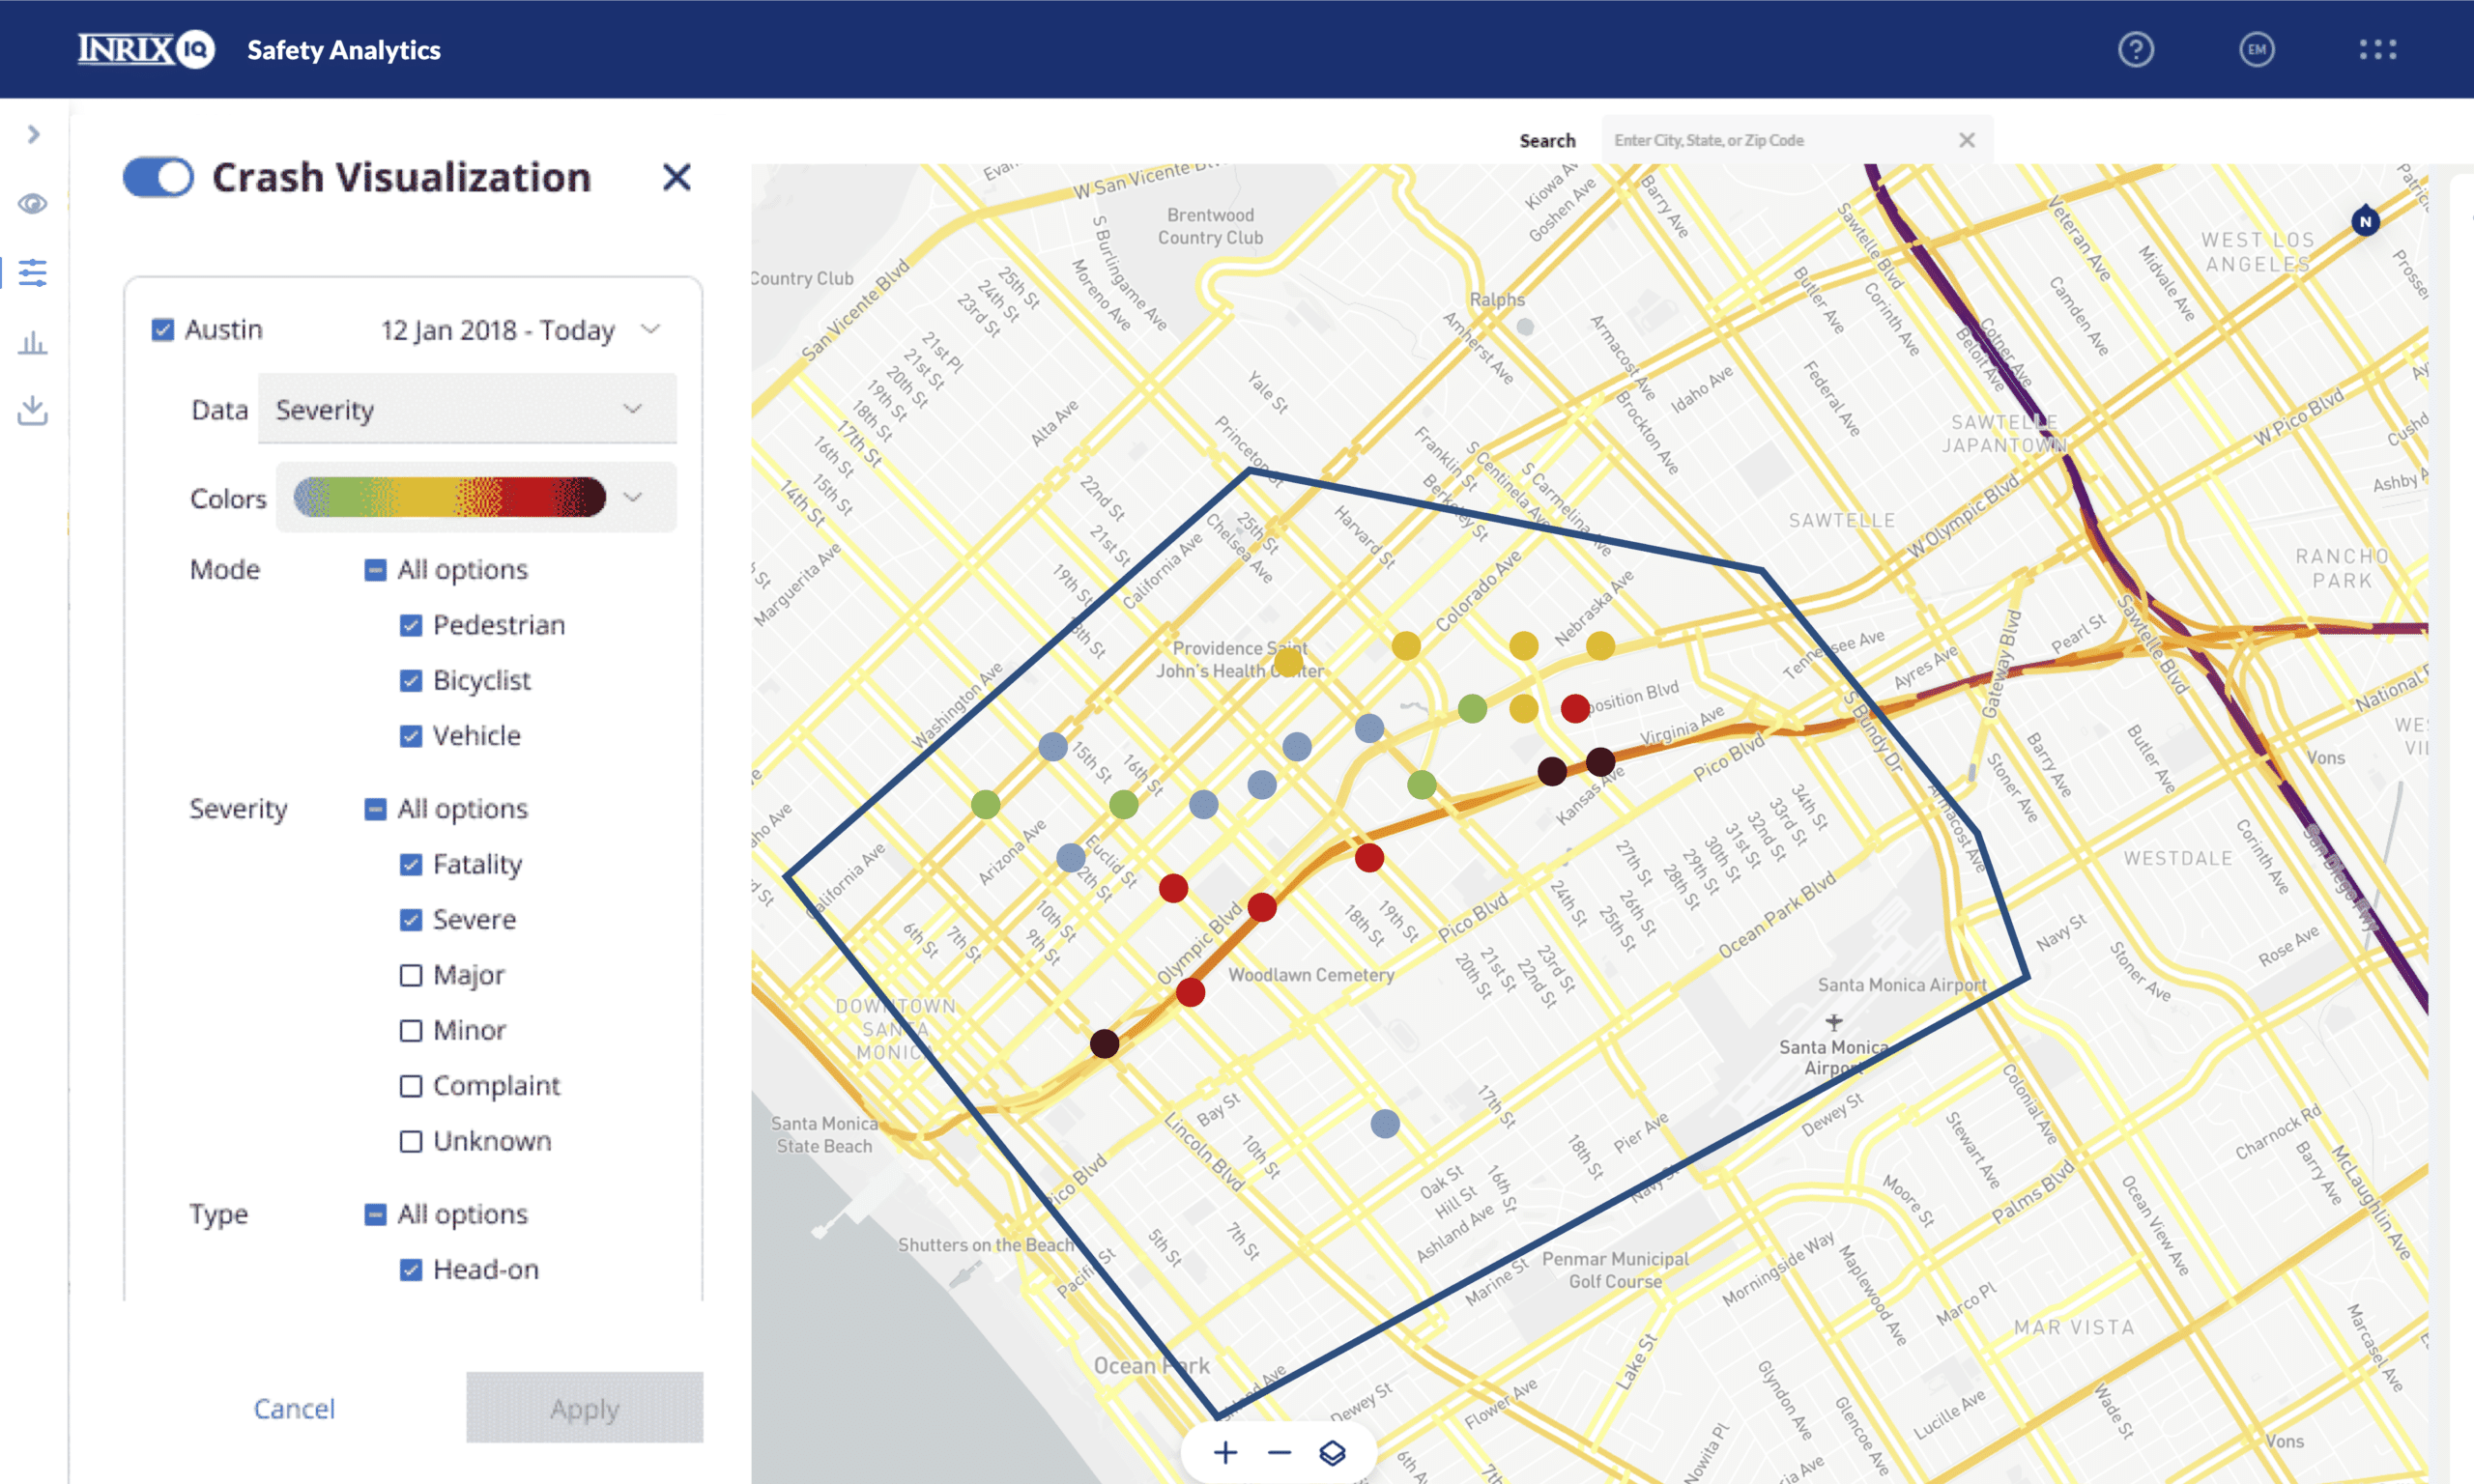
View all the crash locations within your selected area. Choose to display crashes on the map by Severity, Mode, Type, or Contributing Factors.
IDENTIFY RISKY AREAS
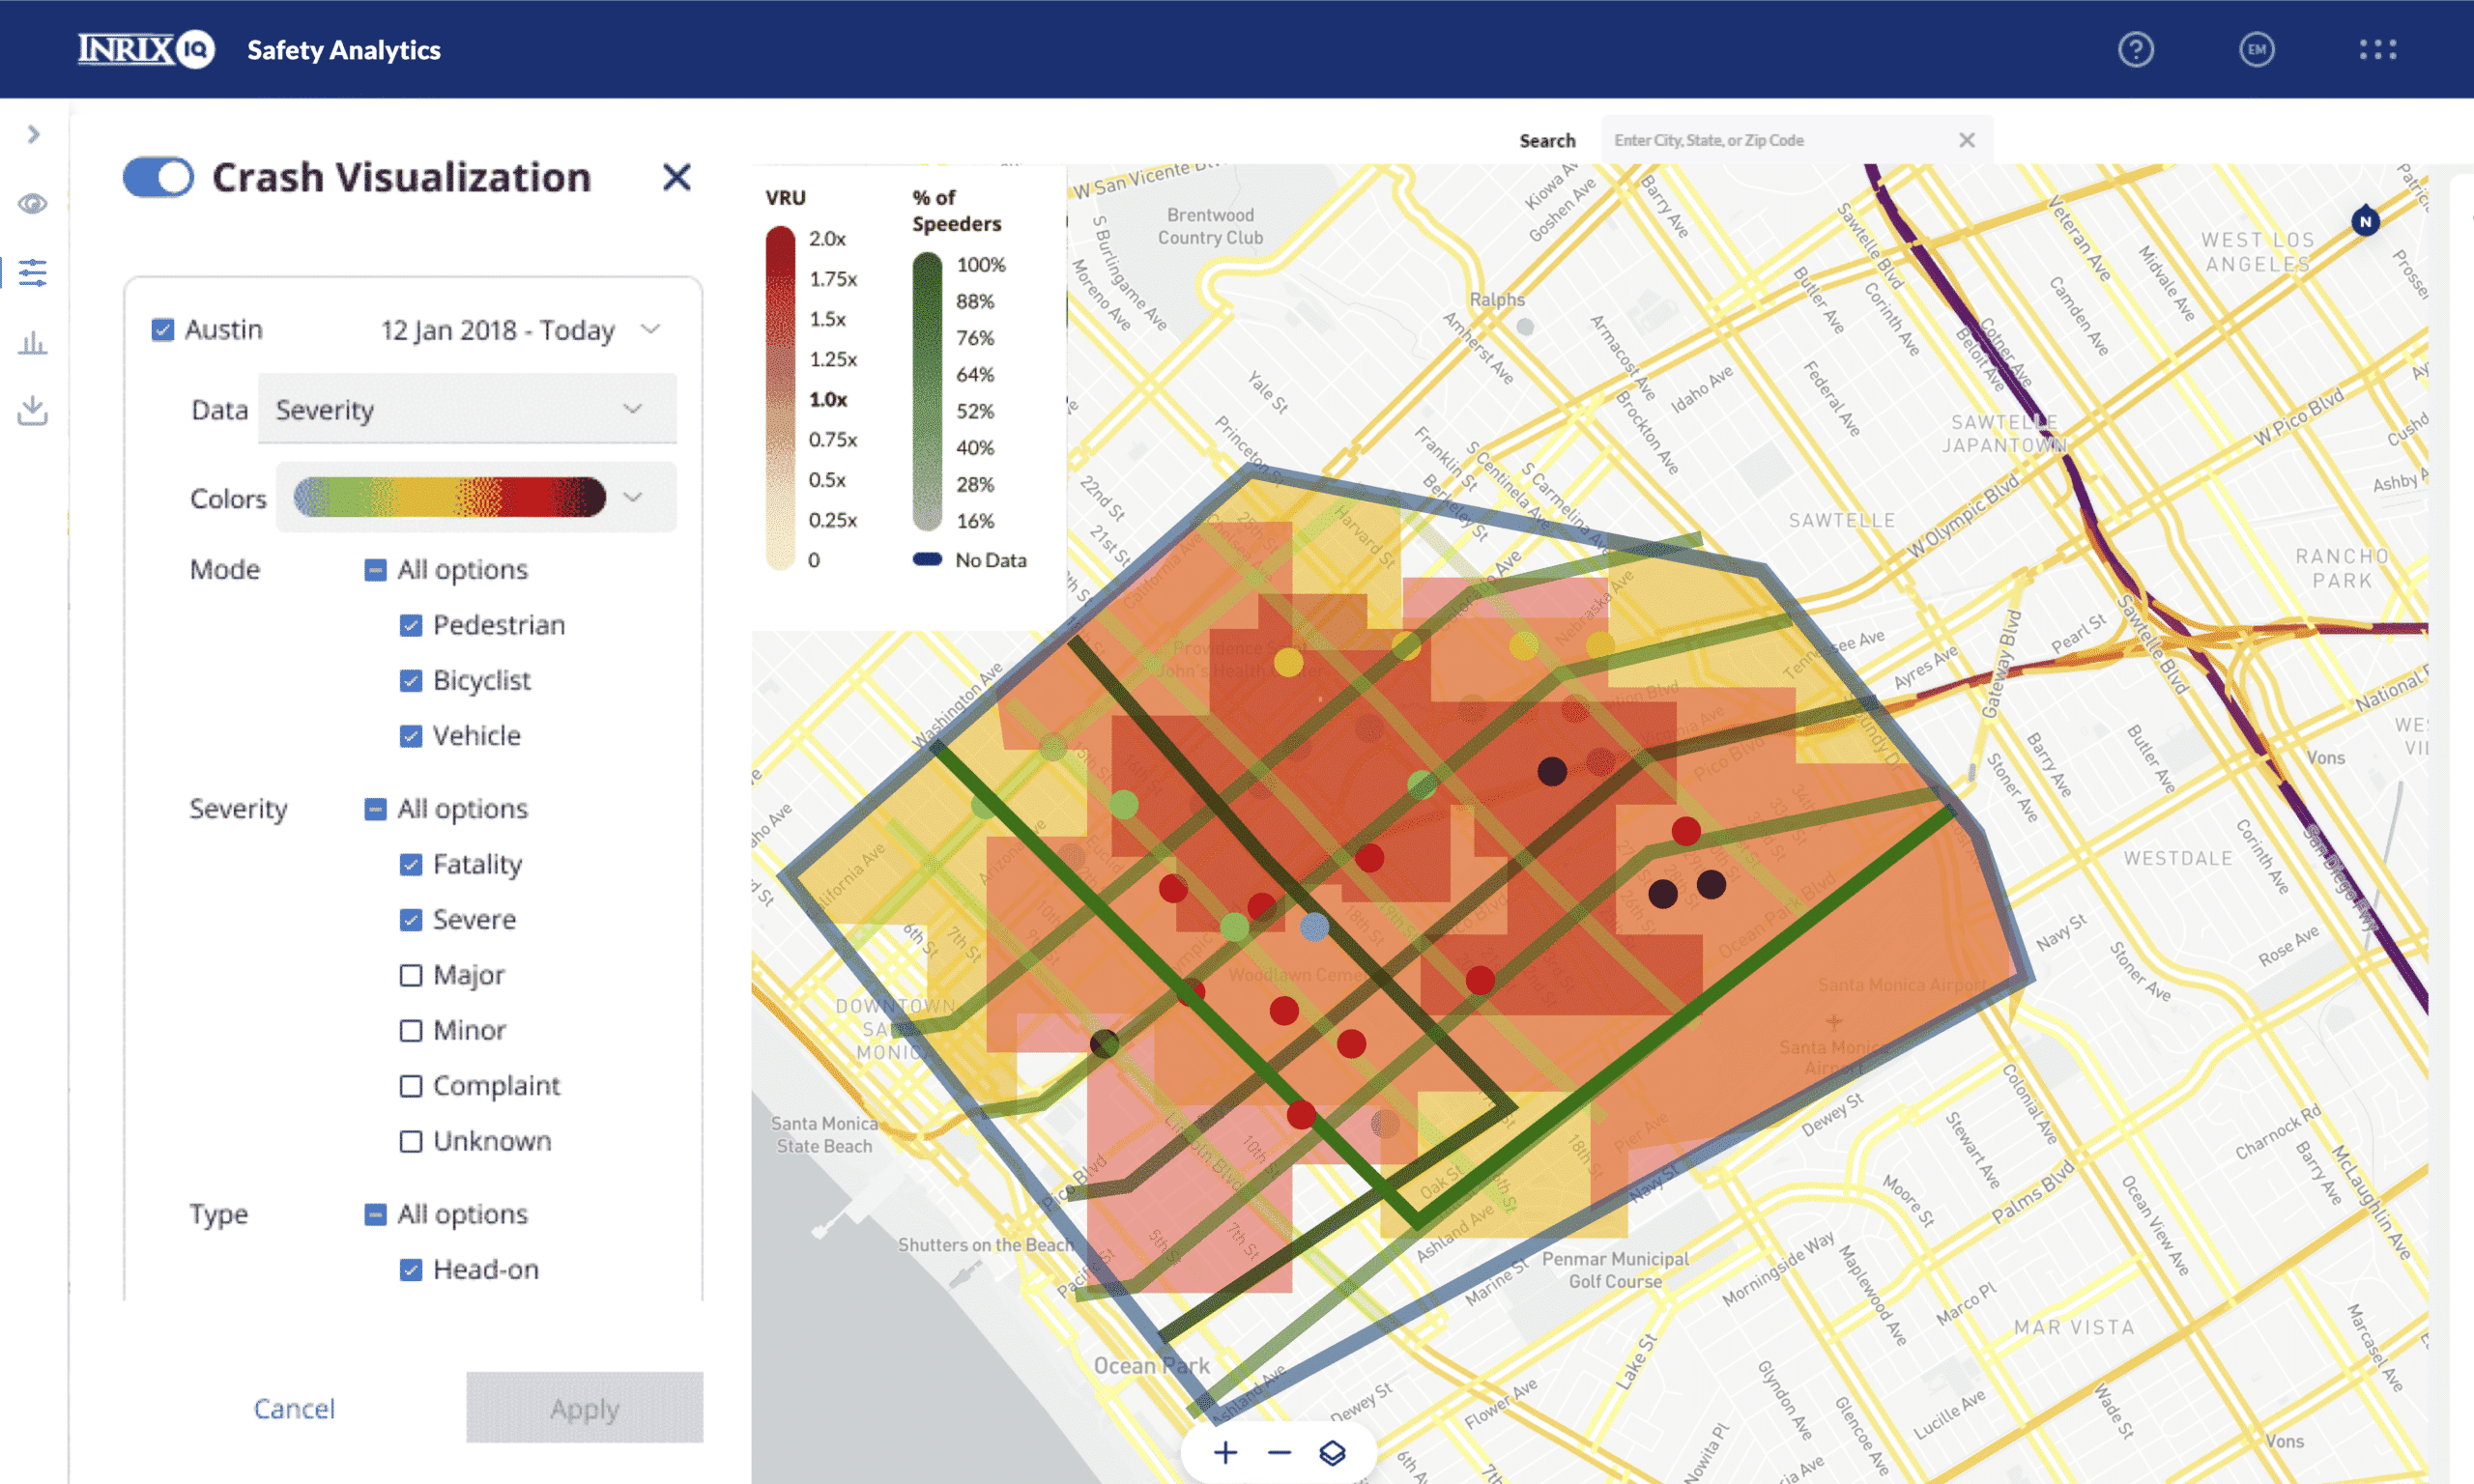
Compare crash history with local data such as vehicle volumes, speeding locations, or VRU concentration to identify locations with more fatal or severe crashes.
ANALYZE ROAD SEGMENTS
Use any of the data types as a filter to identify risky roadway segments and visualize crash count, volume, speed, and safety details for that segment.
Features
-
Easy-To-Use
This intuitive, cloud-based service for road safety analysis allows you to perform detailed analysis without ever leaving your desk.
-
Immediately Available Insights
After signing up online, we flip a switch to instantly turn on your subscribed area so you can start exploring the data instantly.
-
Bring Your Own Data
We will help you bring your own local crash data on top of provided FARS crash data, so you get the complete picture in just one screen.
-
Analyze Risk
Identify roadway segments that match specific risk criteria by using a variety of filters associated with pre-loaded and imported datasets.
-
Data Explorer
Visualize all pre-loaded and imported datasets on the map for every roadway segment in your geography, including speed, volume, and risk score.
-
Time Based Analysis
Query a specific area for different time periods so you can easily view the impact of the safety measure you have implemented for different time periods.