As covered in two earlier blogs in the series – the shift toward remote work during COVID-19 resulted in a significant drop in vehicular trips to and from downtowns. So far, we have examined travel behavior in 20 U.S. downtowns, aiming to comprehend “new normal” travel patterns. Apart from a couple downtowns, most sit below trip levels recorded in March 2020.
Yet, mid-week travel, when compared to Mondays and Fridays, remains strong in many of these downtowns – possibly indicating a higher prevalence of hybrid work over the traditional five-day work week.
However, downtown areas exhibiting a typical AM and PM peak period suggest a more traditional commute pattern where employees are going into the office for work each week.
INRIX wanted to see if the industries surrounding these downtowns provided insight to the various commute patterns seen in downtowns across the U.S.
According to the Census Bureau, three industries have a high prevalence of telecommuting: Information, Finance, and Professional services. About 40% of workers nationwide in these industries report commuting via “Working from Home” in 2021, versus just 13% in all other industries surveyed by the Census Bureau.

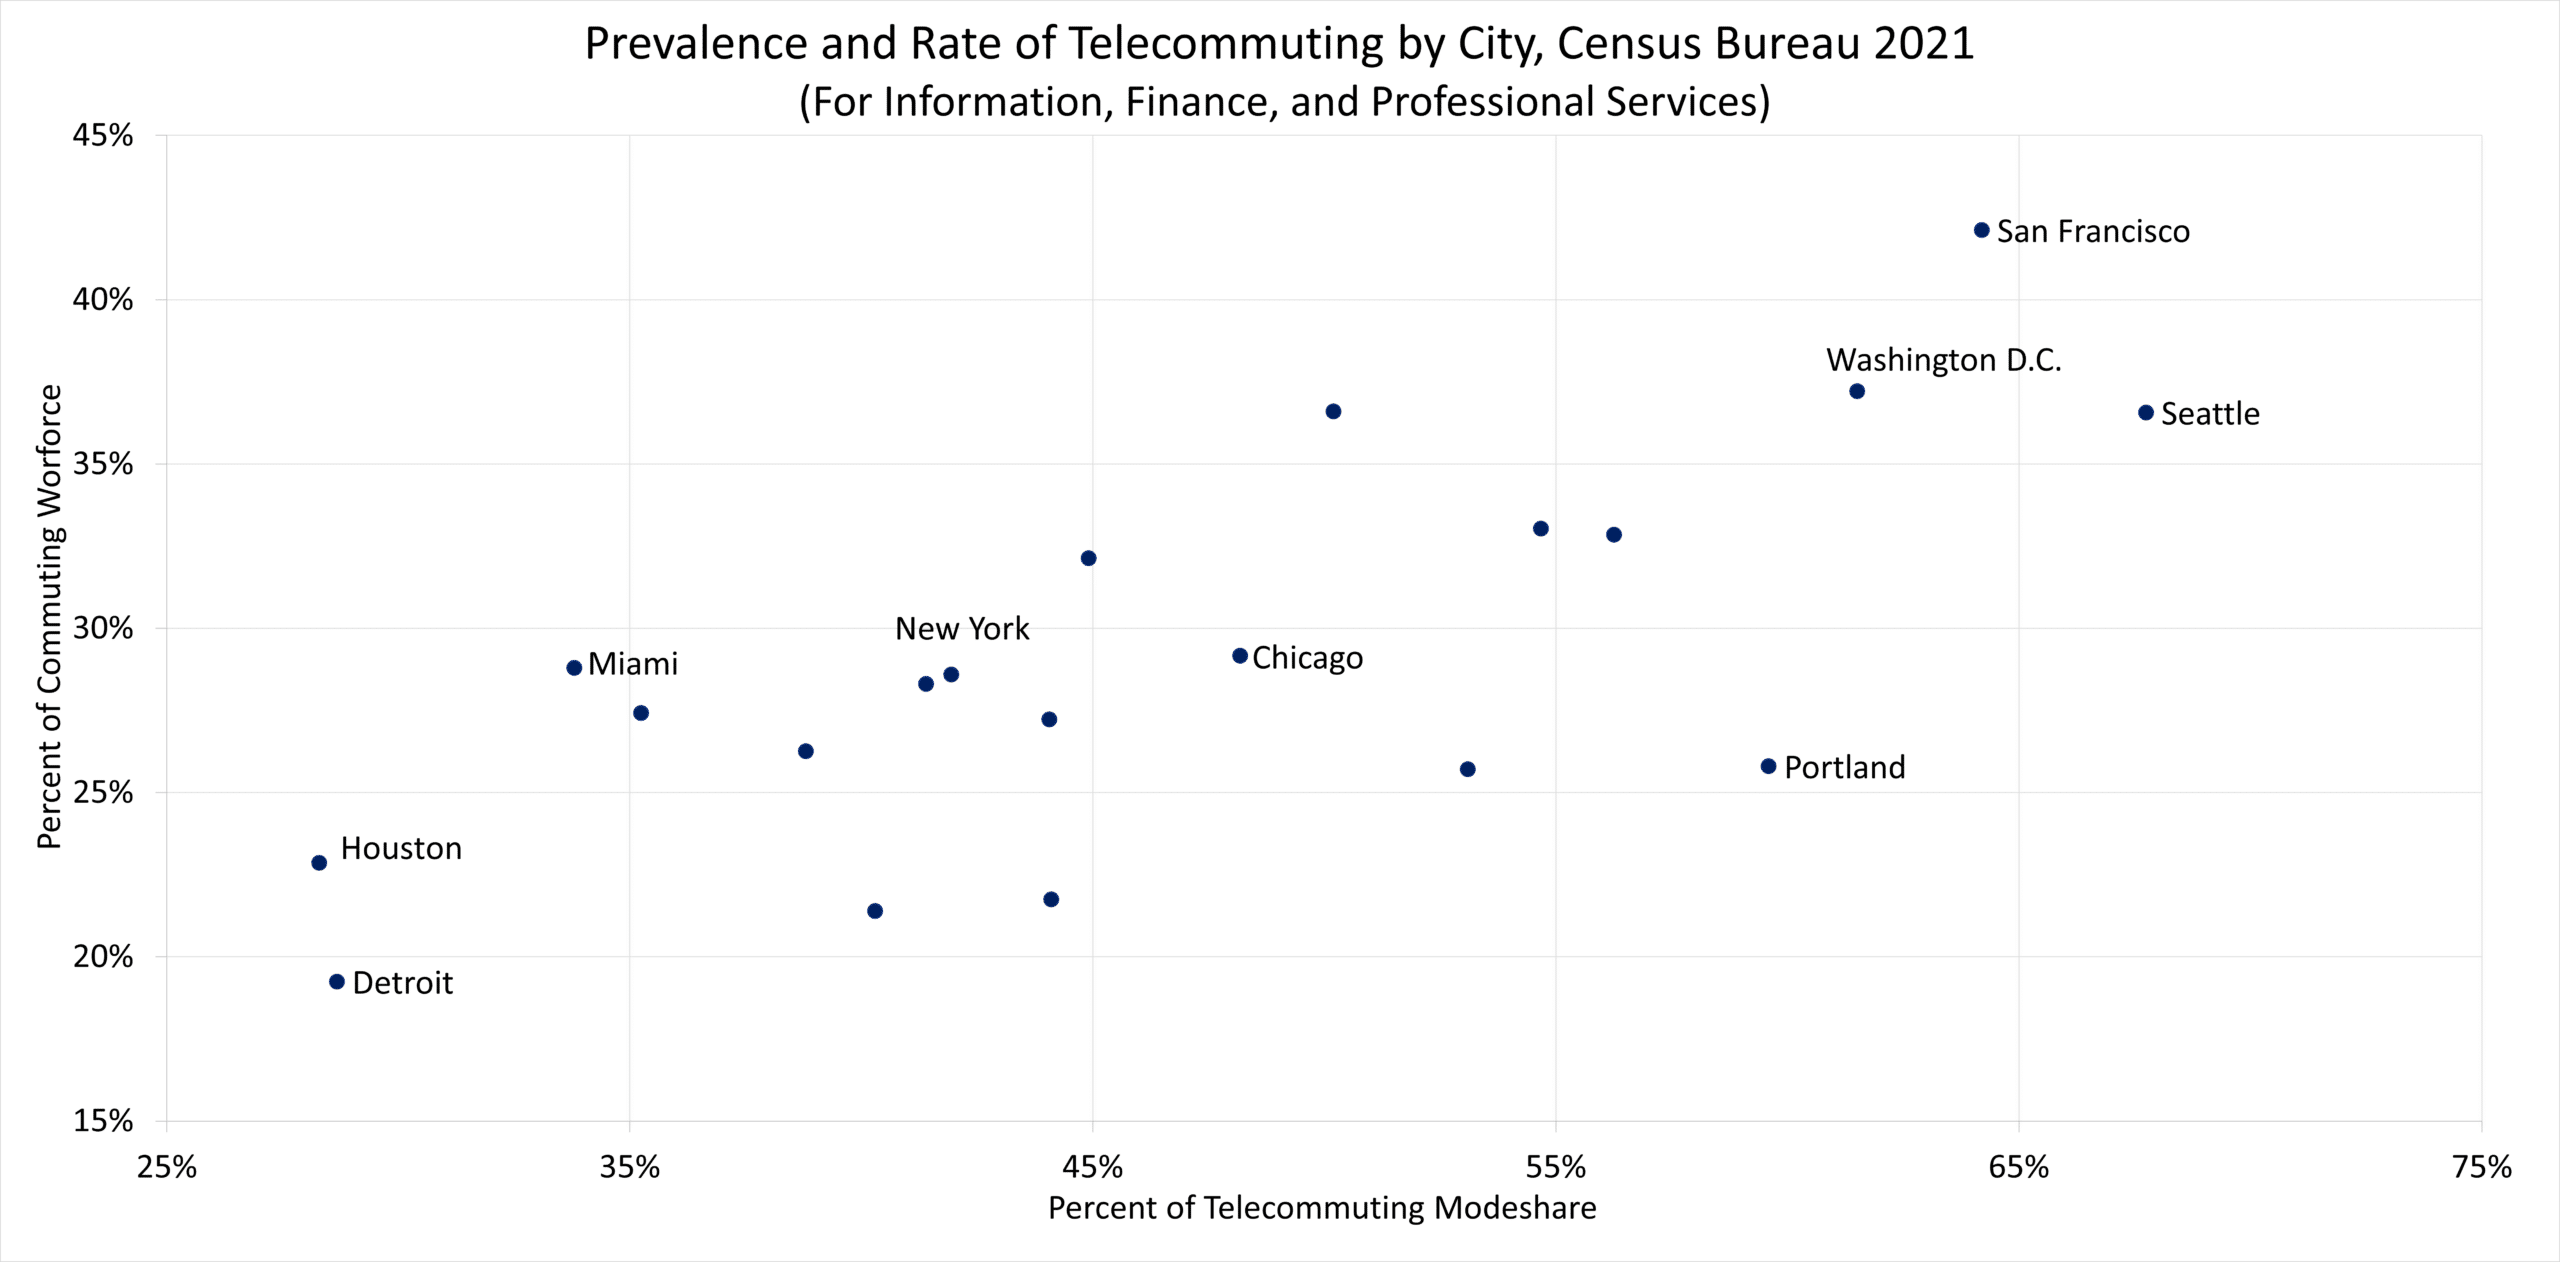
Further, among the 20 cities analyzed, the Information, Finance, and Professional Services Industries comprise of a varying share of the workforce, from a low of 19% in Detroit to a high of 42% in San Francisco.
Since those who work in these three industries are more likely to telecommute, and considering that cities have a large share of the workforce in those industries – it is reasonable to expect high rates of telecommuting in the Bay Area, and therefore, fewer trips to Downtown.
| Information, Financial and Professional Services Industries | ||
| Downtowns | Modeshare | Workforce |
| San Francisco, California | 64% | 42% |
| Washington, D.C. | 62% | 37% |
| Atlanta, Georgia | 50% | 37% |
| Seattle, Washington | 68% | 37% |
| Denver, Colorado | 55% | 33% |
| Charlotte, North Carolina | 56% | 33% |
| Tampa, Florida | 45% | 32% |
| Chicago, Illinois | 48% | 29% |
| Miami, Florida | 34% | 29% |
| New York, New York | 42% | 29% |
| Los Angeles, California | 41% | 28% |
| Dallas, Texas | 35% | 27% |
| San Diego, California | 44% | 27% |
| Phoenix, Arizona | 39% | 26% |
| Portland, Oregon | 60% | 26% |
| Minneapolis, Minnesota | 53% | 26% |
| Houston, Texas | 28% | 23% |
| Philadelphia, Pennsylvania | 44% | 22% |
| Baltimore, Maryland | 40% | 21% |
| Detroit, Michigan | 29% | 19% |
Yet this relationship isn’t entirely linear. Some areas, like Seattle, San Francisco, Washington D.C., and Portland, show commuters in the Information, Finance and Professional Services industries telecommuted at significantly higher rates than those in other cities. In Seattle for example, 68% of those in the Information, Finance and Professional Service industries telecommuted in 2021, a telecommuting rate 50% higher than in Miami.
In short, while it appears the types of industries that surround downtown have a direct relationship on telecommuting, and therefore any ‘Return to Office’ scenario, other regional factors (ability to work from home, population density, labor market, etc.) are likely to be contributors to current commuting patterns. We intend to explore this further in upcoming blogs. Stay tuned.


