


Guest Post By Rick Schuman, VP, Public Sector Americas (rick@inrix.com)
This is the first national look at road traffic demand changes from the COVID-19 virus spread and our collective response. We will endeavor to publish this Synopsis every Monday for the foreseeable future, providing results through Friday of the previous work week.
Key Findings
- Total volume first dropped nationally on Friday March 13th, with major drops beginning the next day
- When compared to typical daily travel:[1]
- Nationally, personal travel dropped through the work week, down 30% Thursday and Friday
- San Francisco, the first area to ‘shelter-in-place,’ down ~50% overall Thursday and Friday
- California, New York and Michigan has largest statewide overall drops, at 36-37% Friday
- Long haul truck traffic is flat, a sign that the national supply chain is holding up so far
- Local area commercial vehicle traffic down near 10%, showing a slow overall decline
- How bad can it get?
- Italy, the first nation to ‘lockdown,’ down 65% overall, 70% in personal vehicle travel
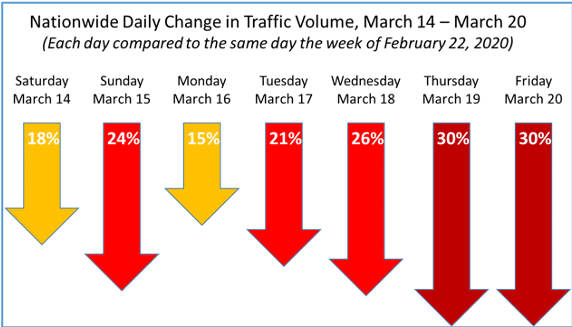
Figure 1
Reader Calls to Action
- If you have colleagues who would be interested in this Synopsis, please forward the link
- Feel free to quote the findings, we kindly request you attribute INRIX
- If you want to get this Synopsis and other COVID-19 related materials as created, sign up at the bottom of this document
- If you want more detail about how this data is created and/or how it could be used interactively, register for our webinar this Thursday, March 26th.
Background
Our incoming data sources – providing anonymous speed/location reporting to us in real-time – generate over 100 million trips per day in the US across consumers, local fleets, and long haul trucks. We use this data to create a myriad of real-time and near real-time services, and this data network gives us a unique and timely window into the nation’s roadway travel. Our data sources span the full range of vehicle types using the national network and provides information about all roads in the network, not just major roads.
In addition to our real-time speed and congestion information, much of which is being used by the media to document the impact of the virus on travel, our trip data can serve as a proxy for overall road usage trends at national, state and local levels. In this extraordinary time, we have re-purposed our INRIX Trips metadata to generate relevant summary level information about traffic demand.[2] The below documents are what we have observed thus far, with Figure 1 providing the national summary.
With only a 48-hour lag, we hope that this information will be useful to policy makers and the public. And we too look forward to the week, hopefully soon, when we can report on congestion and volume growth – as this will be a sure sign of recovery.
Synopsis
When a tsunami hits, it’s hard to tell from the initial surge if it’s just a rogue wave or something bigger. So here we are on March 23, and it’s obvious we are in the middle of a tsunami, on many fronts. In terms of highway transportation, our data shows that in the US the first wave hit on Friday, March 13th. Yes, Friday the 13th of all days (oddly, major stock market indices were up 9% that day – so much for the omnipotent ‘market.’). After 16 straight days of increasing travel, national volume suddenly reversed, dropping 5%. In normal times, volume changes would move incrementally, almost undetectable day-by-day. 5% changes in one day just don’t happen. Normally. The tsunami started.
As Figure 1 illustrates, it has only gotten worse, with national declines topping 30% this past Friday. Notably, the decline is worse each day through Thursday, and stabilizing somewhat on Friday. How bad can it get? As an example, our data from Italy, the first country establish nationwide restrictions, shows an overall 65% drop in total traffic volumes, with a 70% drop in passenger vehicle travel. And as of this past Sunday night, Italy has increased restrictions significantly. Thus we can expect even further traffic declines there as restrictions increase.
Digging a little deeper, so far, the decline in national passenger traffic volume is directly tied to a decline in total trips, with distance-per-trip increasingly slightly from 9.2 miles to 9.4 miles. With the reduction in congestion as reported by INRIX Research, we are seeing slightly shorter trip times, with 18.5 minutes per trip dropping to 17.8 minutes.
A silver lining, if there is one, is that commercial traffic is holding up. Long haul truck traffic is holding steady – a hopeful sign as we clearly need the nation’s logistics backbone to continue to function. Local fleets, such as service vehicles and local deliveries, are experiencing a drop nationwide, slightly under 10% through the week. These commercial traffic trends bear watching.
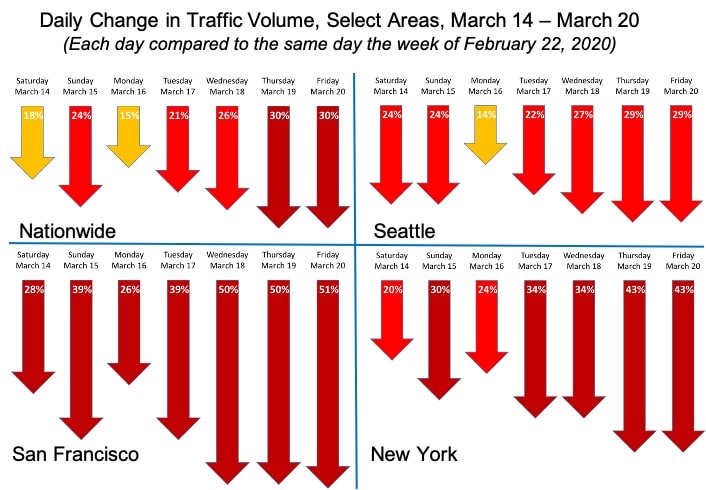
The three metropolitan areas with either the earliest outbreaks and/or the most aggressive restrictions are Seattle, San Francisco, and New York City. Figure 2 shows the relative change in overall traffic volumes in these areas relative to the nationwide data. Seattle, with the earliest outbreak has the least restrictive official policies, and so it turns out less than half the drop in travel of the others.
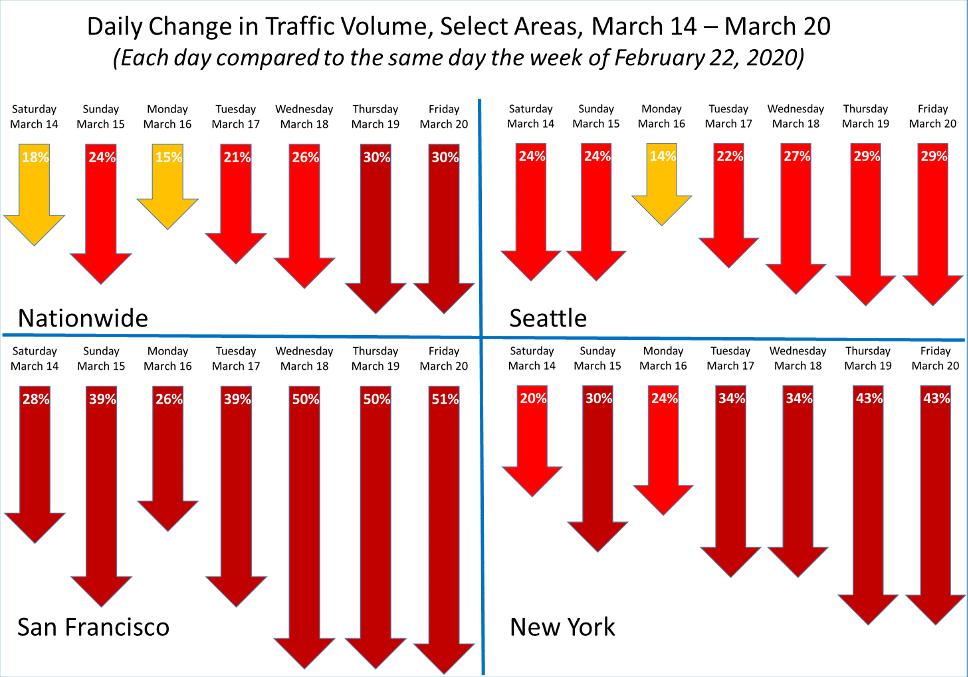
Figure 2
Side note: What happened Monday? Consistently across the country, while traffic dropped, it dropped less than Sunday. My hypothesis is a combination of workers trying to get one last day in the office coupled with those who went to work and were promptly laid off as employers hunkered down, a trend that continued as the week went on. If you have a better hypothesis, please email me.
The final table to share this week is a simple day-by-day summary of traffic in ten largest states and metropolitan areas (adding Seattle and San Francisco as well). Table 1 illustrates when travel patterns were normal or normal enough (green), when the trend line turned down (yellow), and when declines began in earnest (red). An interesting general observation is how quickly most went from everything is fine to major declines. In fact, Georgia immediately saw a significant decline on March 14 after a slight increase on March 13. The Table also shows the extent of overall traffic decline by Friday. The numbers vary widely, but all are down significantly, with Georgia and North Carolina the only regions with less than a 25% decline by Friday.
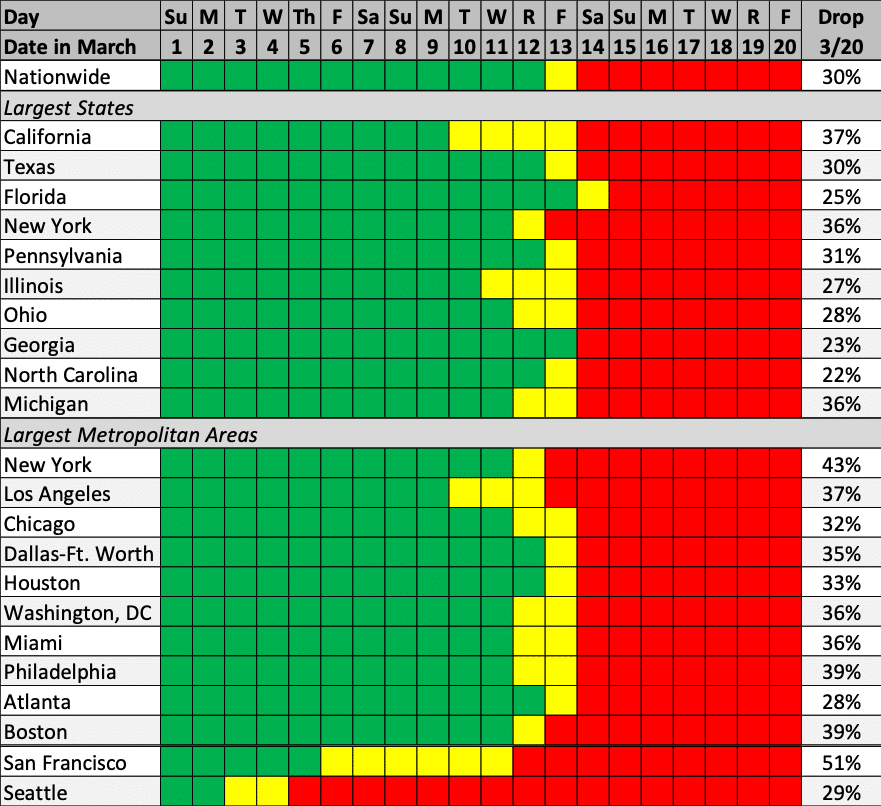
Table 1 – Change in Traffic for Larger States and Areas (Green – normal, Yellow – tending down, Red – large decline)
Florida – illustrated by a number of stories of packed spring break beachgoers ignoring social distancing recommendations – held out an extra day before trending down. In Orlando, all major theme parks closed beginning Monday, and by Wednesday, Orlando-area traffic was down 30%. This was with no government restrictions in place. This was a pure demand drop, illustrating the magnitude of the potential impact on regions and parts of the economy based on discretionary spending, such as tourism.
Note that when discussing the data, the tone is these declines are bad. Certainly, through an economic lens, this is true. But declines also correlate to increased compliance with government restriction and recommendations, which are intended to flatten the curve. It is hard to break out of the frame of reference where drops in economic activity are bad. We will do our best in the coming editions of the INRIX Travel Volume Synopsis to, as they say, just call balls and strikes, leaving commentary to others.
Want more Info?
If you wish to learn more about how we generate this insight and the movement data behind the Synopsis, or how you can get more detailed local information, updated daily, register for our webinar this Thursday, March 26th.
[1] Given the day of week pattern of travel demand, we compare a given day and area to the same day/area in a previous week, and we are using the week commencing Saturday, February 22, 2020 as our typical week
[2] Metadata used is total trip distance of all INRIX Trips originating in the country/state/region each day