- Istanbul topped global list for second consecutive year, Chicago overtook New York City as #1 in U.S.
- Traffic continues to grow in the vast majority of urban areas, as economic and population growth continue to overwhelm infrastructure capacity
- Traffic safety significantly improved in the U.S. and returned to pre-pandemic levels, bucking a four-year troubling trend on our roadways
BELLEVUE, Wash. – December 1, 2025 – INRIX, a global leader in transportation data and analytics, today released the 2025 Global Traffic Scorecard, the world’s most comprehensive benchmark of mobility performance. Spanning 36 countries and nearly 1,000 cities, the Scorecard reveals a world where congestion is climbing almost everywhere, except in three standout cities rewriting the rules of urban movement.
Congestion and traffic delays continued to increase in urban areas around the world. Of the 290 U.S. cities analyzed, congestion increased in 88% of them. However, congestion in London, Paris, and New York City remained at current levels or even decreased.
Congestion Rises, Commuters Return, Transit Lags
Chicago (112 hours lost), New York City (102 hours), Philadelphia (101 hours), Los Angeles (87 hours) and Boston (83 hours) are the most congested cities in the United States, costing drivers $2,063 each in Chicago alone. Amidst increasing delays in urban areas across the globe, congestion levels in New York City remained flat in 2025. The city’s new congestion pricing policy is a likely factor in its control of traffic congestion.
Overall, however, U.S. cities experienced increasing traffic congestion in 2025. Congestion increased in 254 of the 290 cities analyzed, as travel returned to pre-COVID congestion levels. The percentage of people commuting by car is nearly back to 2019 levels. Public transit, however, has not made the same recovery and is down 22% from 2019.
More than three-fourths of people in U.S. cities commute by car, significantly outweighing other modes of commuting and work. Just 13% of people work from home, 4% take public transit, and 5% rely on other modes like taxis, walking, and cycling.
Where people are working is stabilizing. In 2023 and 2024, fewer people worked from home as businesses and organizations increasingly brought employees back into the office, often in urban areas, a factor in travel returning to pre-COVID levels. This return to the office slowed significantly in 2025, dropping by only 2%, indicating that shifts in working environments and habits have stabilized.
Housing Costs and Infrastructure Strain
Beyond growing travel demand, structural factors are intensifying congestion pressures. Rising housing costs are pushing many workers farther from job centers, contributing to the rise of so‑called “super commutes.”
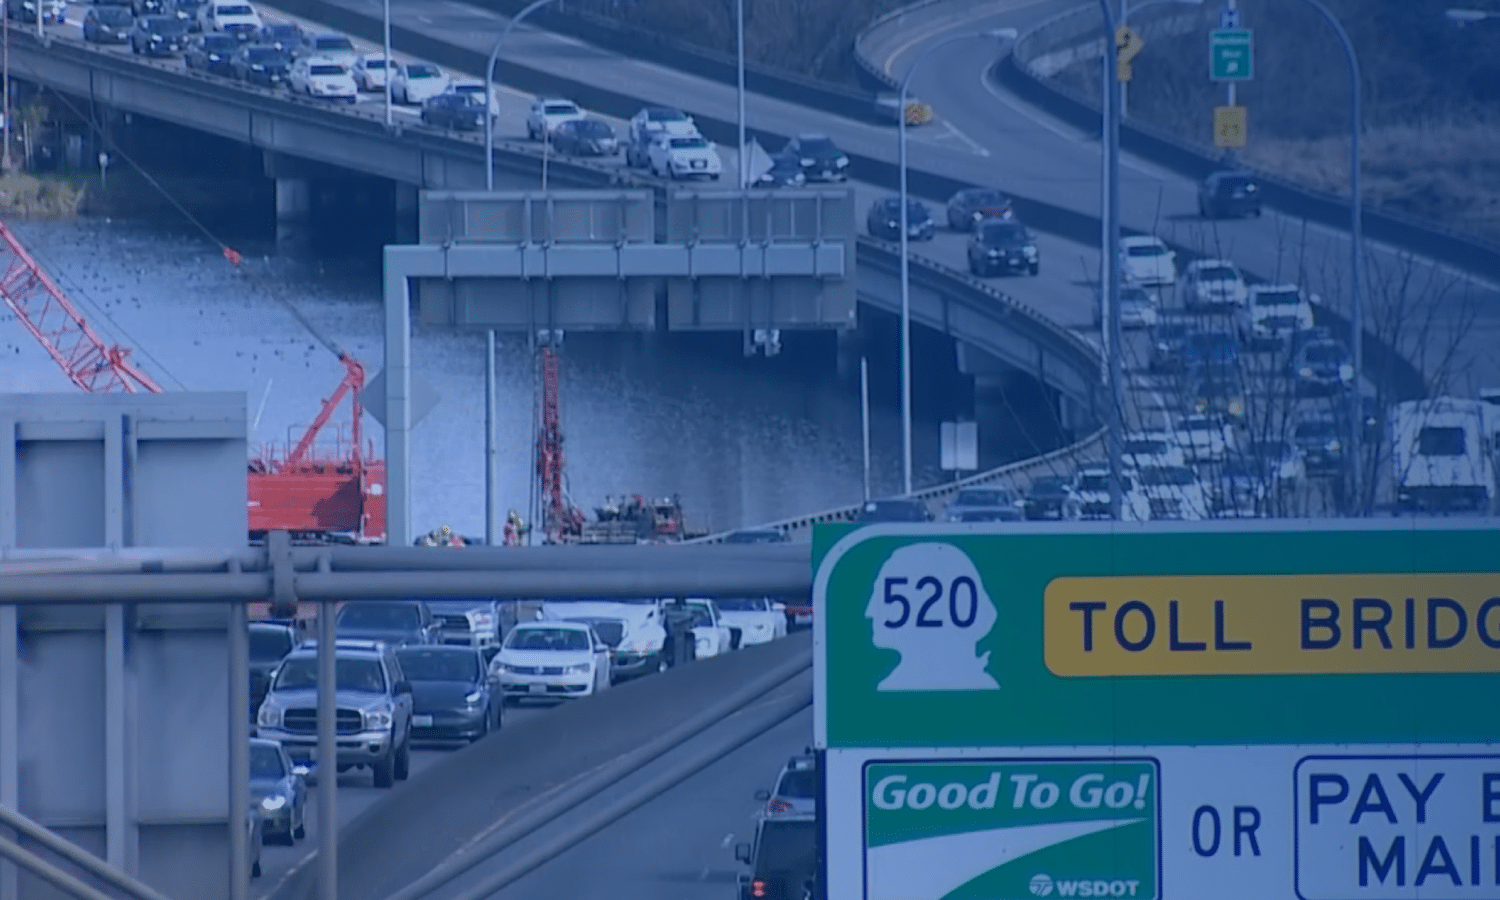
In cities where affordability is lowest, residents face a difficult tradeoff between longer travel times and higher rents, adding strain to regional road networks. At the same time, billions in infrastructure spending have struggled to keep pace with demand. Aging bridges, major construction corridors, and delayed upgrades continue to amplify delays, particularly in fast‑growing metro areas.
Traffic Safety: U.S. Fatality Rates Improve for First Time in Four Years
2025 brought one of the few bright spots in U.S. mobility: Traffic fatalities declined, returning to pre-COVID levels after spiking for four years. While this is welcome news, fatality rates in the U.S. remain significantly higher than those in the U.K. and Germany, a reminder that Vision Zero goals for 2030 remain challenging.
London and Paris: Building Cities Designed for Fewer Cars
Along with New York City’s congestion decline, traffic congestion in London and Paris either remained the same or decreased in 2025. However, these major urban centers were an anomaly. In the U.K., congestion increased in most urban areas. This increase was outweighed by London’s drop in traffic, which accounts for nearly half of all delays in the U.K.
Germany, though, saw relative spikes in 2025 traffic delays. Congestion increased in 62 German cities, with Cologne taking the top spot in the German ranking. Eight German cities saw decreases in congestion, while three remained the same. Overall, congestion in the U.K. and Europe returned to pre-COVID levels.
Micromobility and Driverless Tech: Two Growth Forces to Watch
Across several U.S. cities, micromobility saw meaningful adoption, driven not just by demand but by cities expanding fleets and introducing new vehicle types like seated scooters and throttle-only e-bikes. Seattle and Washington, D.C., are among those seeing notable quarter-over-quarter growth.
Meanwhile, autonomous vehicles are entering a new phase. Waymo expanded its service onto freeways in San Francisco, Phoenix, and Los Angeles, and launched paid robotaxi service in Florida and Texas. As congestion intensifies and safety remains a priority, interest in automated vehicle technologies, from driverless taxis to automated braking, continues to grow.
Finally, the World Cup is coming to U.S. cities in 2026. With the games will come massive amounts of traffic and fans from across the globe, unaccustomed to those cities’ transportation systems. U.S. cities, particularly Los Angeles, are already planning for the influx of traffic and commuters. The World Cup games will be a true test of how well cities are able to address congestion.
INRIX: Using Data to Drive Smarter Mobility Decisions
The key findings of the INRIX 2025 Global Traffic Scorecard provide a quantifiable benchmark for governments and cities across the world to measure progress to improve urban mobility and track the impact of spending on smart city initiatives. Please visit www.inrix.com/scorecard for the full report.
Access to reliable, consistent data is the first step in addressing traffic congestion. INRIX data and analytics on mobility, traffic signals, parking, safety and population movement can help city planners and engineers make data-based decisions to prioritize spending to maximize benefits and reduce costs now and into the future.
###
About INRIX
Founded in 2004, INRIX pioneered intelligent mobility solutions by transforming big data from connected devices and vehicles into mobility insights. INRIX has harnessed machine learning and artificial intelligence to deliver precise and actionable mobility data. This revolutionary approach enabled INRIX to become one of the leading providers of data and analytics in people and vehicle movement. With partners and solutions spanning across the mobility ecosystem, INRIX is uniquely positioned at the intersection of technology and transportation. Learn more at inrix.com.
INRIX Media Contact
Lucy Meneghello
Communiqué PR
206-282-4923 ext. 129