KIRKLAND, Wash. – September 16, 2022 – INRIX Inc., a world leader in mobility analytics and connected car services, today announced new features and improvements to INRIX IQ Signal Analytics to help transportation engineers better understand traffic signal performance based on vehicle stops, delays, or speed.
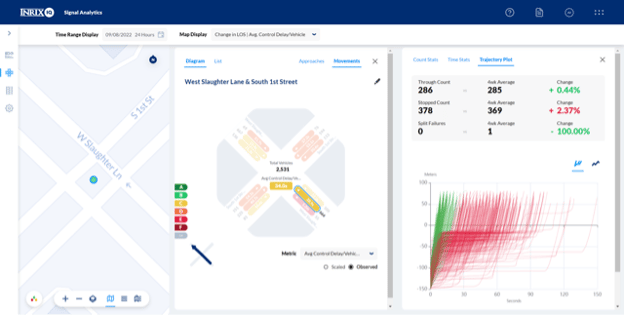
Signal Analytics now includes powerful new vehicle trajectory plots to help agencies diagnose and resolve signal timing issues. Trajectory plots allow a user to visualize discrete vehicle paths for every approach or movement at any intersection available within the Signal Analytics tool.
“We are extremely excited to enhance Signal Analytics with these new features,” said Steve Remias, Head of Product for Signal Analytics at INRIX. “We leverage customer feedback and industry expertise to identify and build new ways to visualize traffic signal performance for our users. We continuously look for product improvements that help traffic engineers, planners and officials do their jobs more effectively.”
In addition to trajectory plots, improvements were made to the corridor performance measure functionality within Signal Analytics. Historically, for an engineer or planner to receive travel time information along a corridor someone would need to either drive the corridor or equipment would need to be installed. Signal Analytics can now provide travel times on user defined corridors with a few clicks. These new features and improvements are immediately available in Signal Analytics, a benefit of cloud-based services.
Signal Analytics is a cloud-based application used by agencies in 18 states to measure and improve traffic signal performance. Leveraging more than 100 million trips and a billion miles daily, Signal Analytics delivers every metric necessary for operators to fully understand performance on nearly 250,000 signalized intersections across the U.S. Customizable reports and dashboards highlight key metrics, problems and trends for intersections and corridors across a road network. In-depth searches and advanced functionality, such as user-defined date(s) and time periods, leverage the Center for Advanced Transportation Technology (CATT) Laboratory at the University of Maryland’s powerful Regional Integrated Transportation Information System (RITIS) platform.
To learn more about how INRIX Signal Analytics can help improve signal performance in your area stop by INRIX booth #1023 at ITS World Congress in Los Angeles to see a live demo or check out INRIX IQ Signal Analytics.
###