
INRIX U.S. Signals Scorecard 2022 Annual Summary
INRIX U.S. Signals Scorecard 2022 Annual Summary provides the most comprehensive baseline of signal system demand and performance published and benchmarks the post-Covid baseline - 'The New Normal'.
Utilizing INRIX Signal Analytics,[1] the Scorecard calculates demand and performance for all movements at each individual signal, aggregating results by county, metropolitan area, state, and nationally.
Demand and performance are assessed using GPS data from vehicles nationwide. A vehicle's heading, travel time and speed are recorded any time it travels through a signalized intersection. This allows a scalable approach to understand the demand and performance of intersections nationwide.
This is the third edition of U.S. Signals Scorecard, still the only systemic nationwide analysis of individual traffic signal performance. This edition follows the same methodology as the previous editions.[2]
For Information on INRIX IQ Signal Analytics, offered in partnership with the CATT Laboratory, see: https://inrix.com/products/signal-analytics/ https://inrix.com/signals-scorecard/archive
© INRIX, Inc. 2023
Learn More
- 242,757 signals mapped consistently across all 4 weeks of data collection across the year[1]
- All signals are located within a county and state, and where appropriate, a metropolitan planning area boundary
- INRIX Signal Analytics uses OpenStreetMap (OSM) data to identify signalized intersections; 'Add Signals' Section explains how additional signals can be added to future scorecards
States back to top
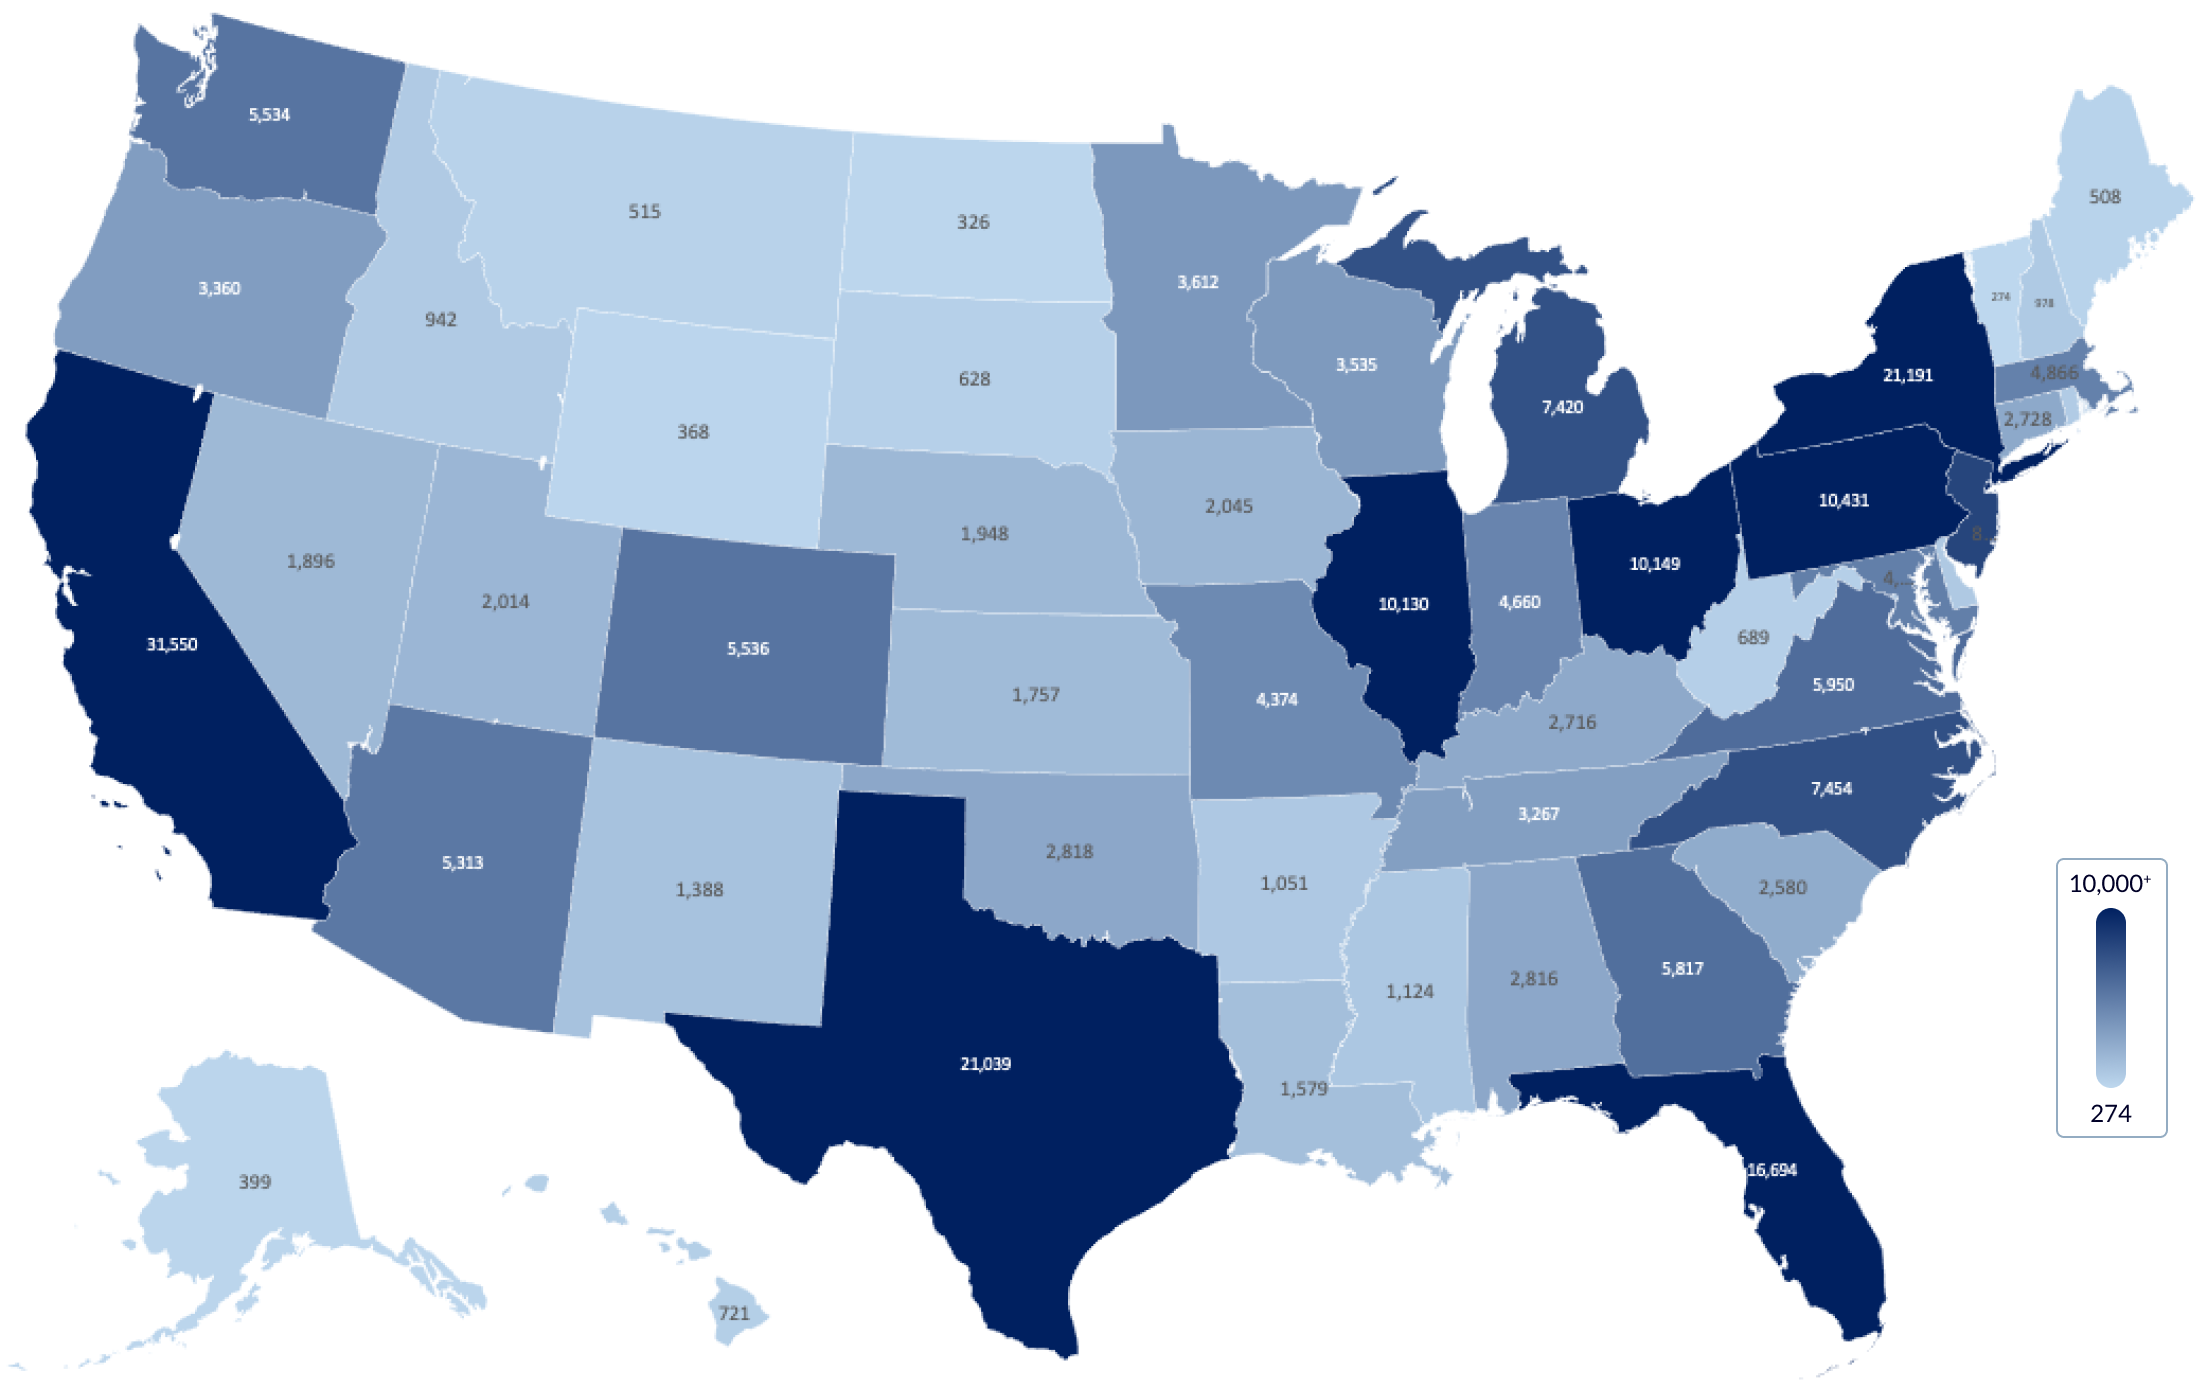
Every State has signals analyzed, ranging from 274 in Vermont to 31,550 in California.
Metropolitan Areas back to top
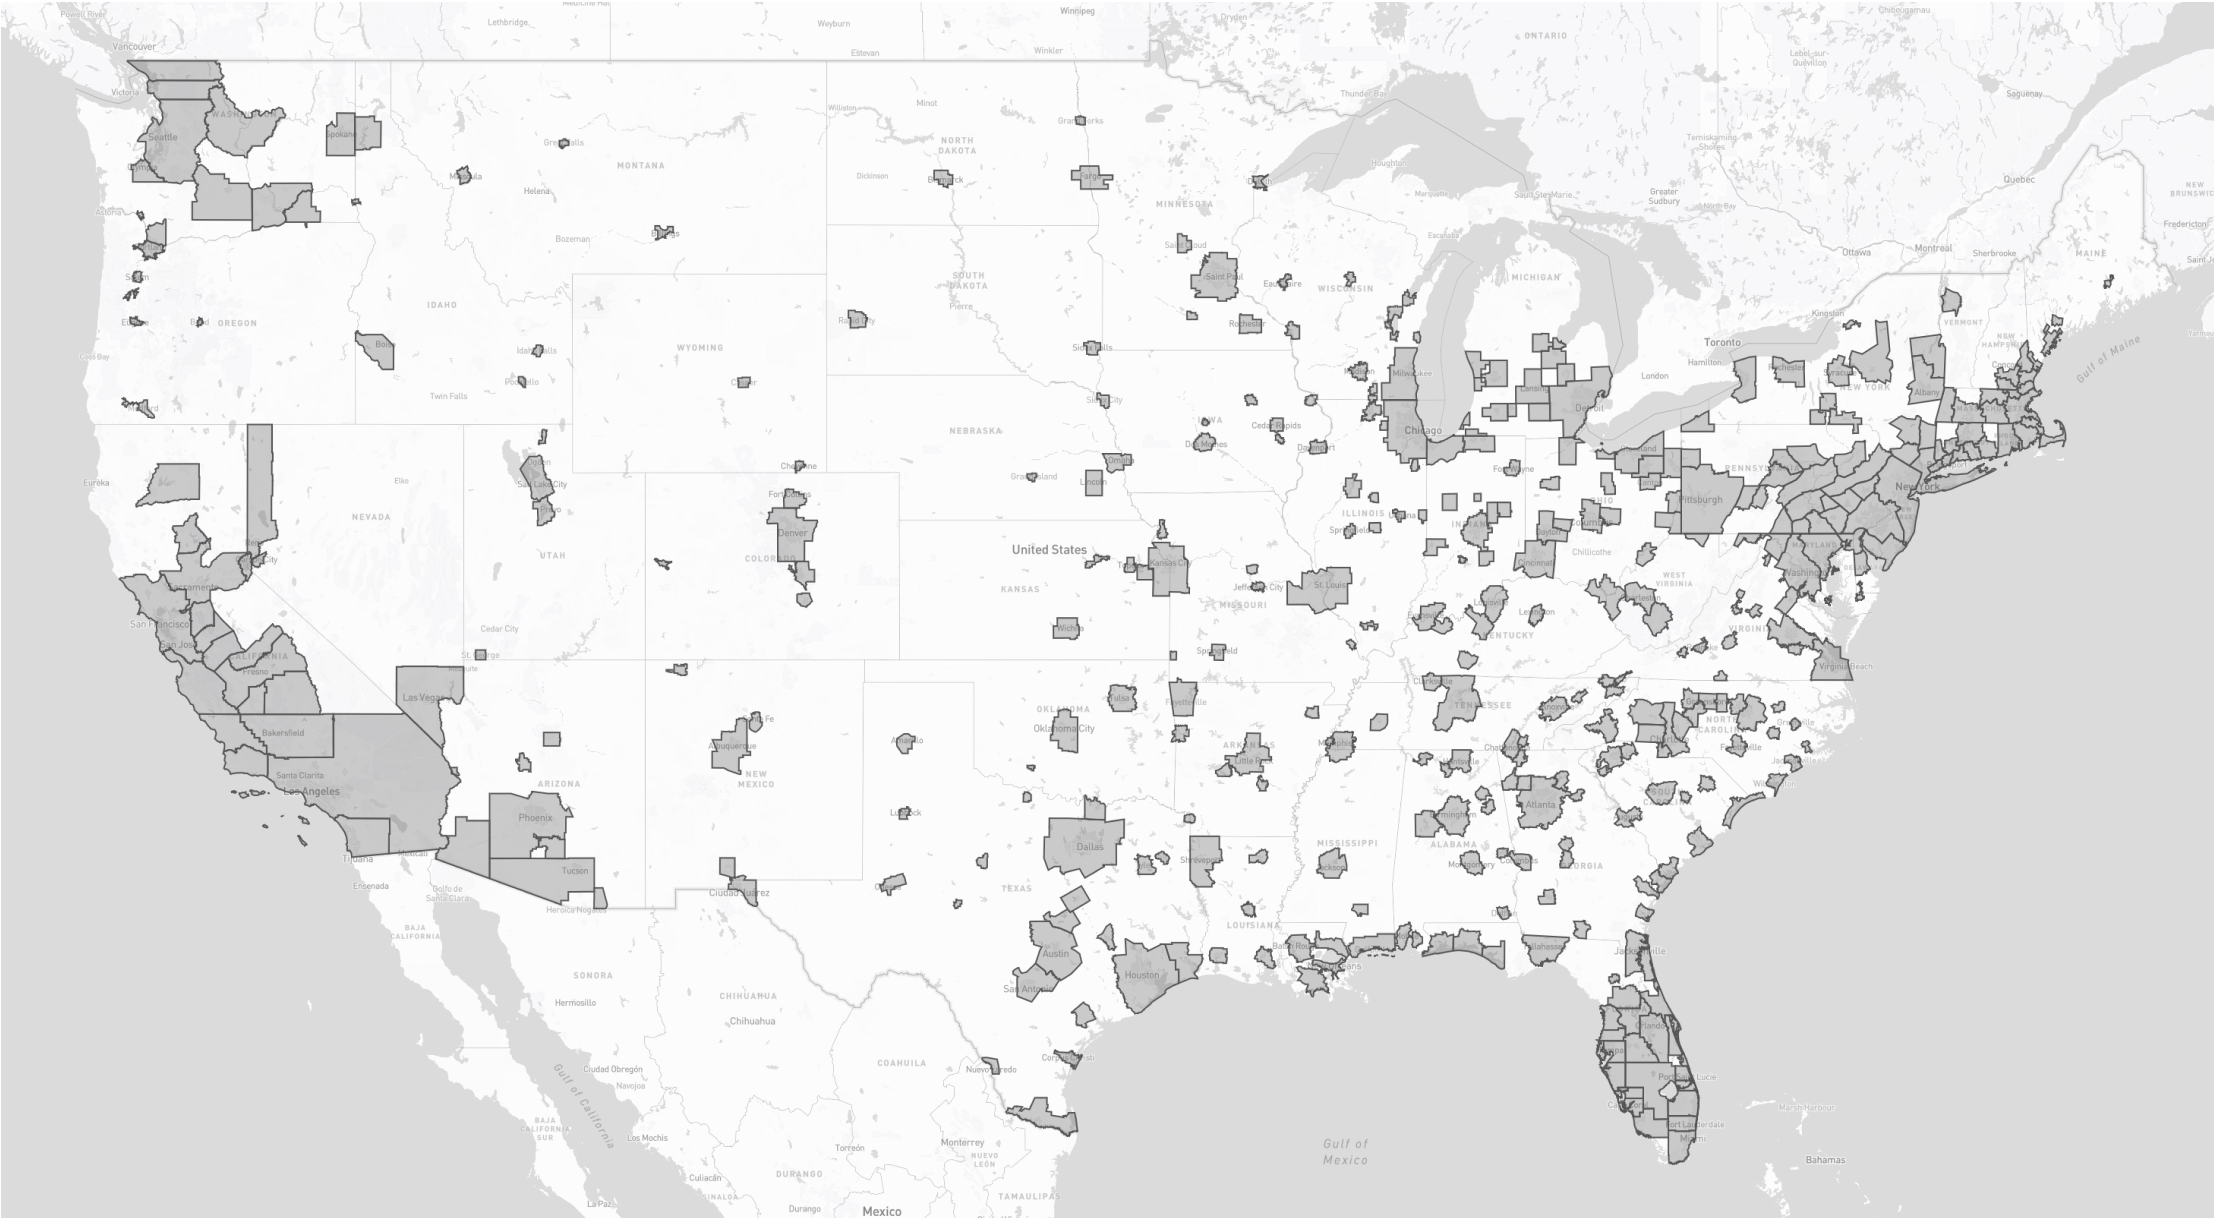
- 92% of the signals are located within the boundaries of 401 Metropolitan Planning Organizations (MPOs)
- 47 MPOs have at least 1,000 signals
- 137 MPOs have at least 250 signals
- 271 MPOs have at least 100 signals
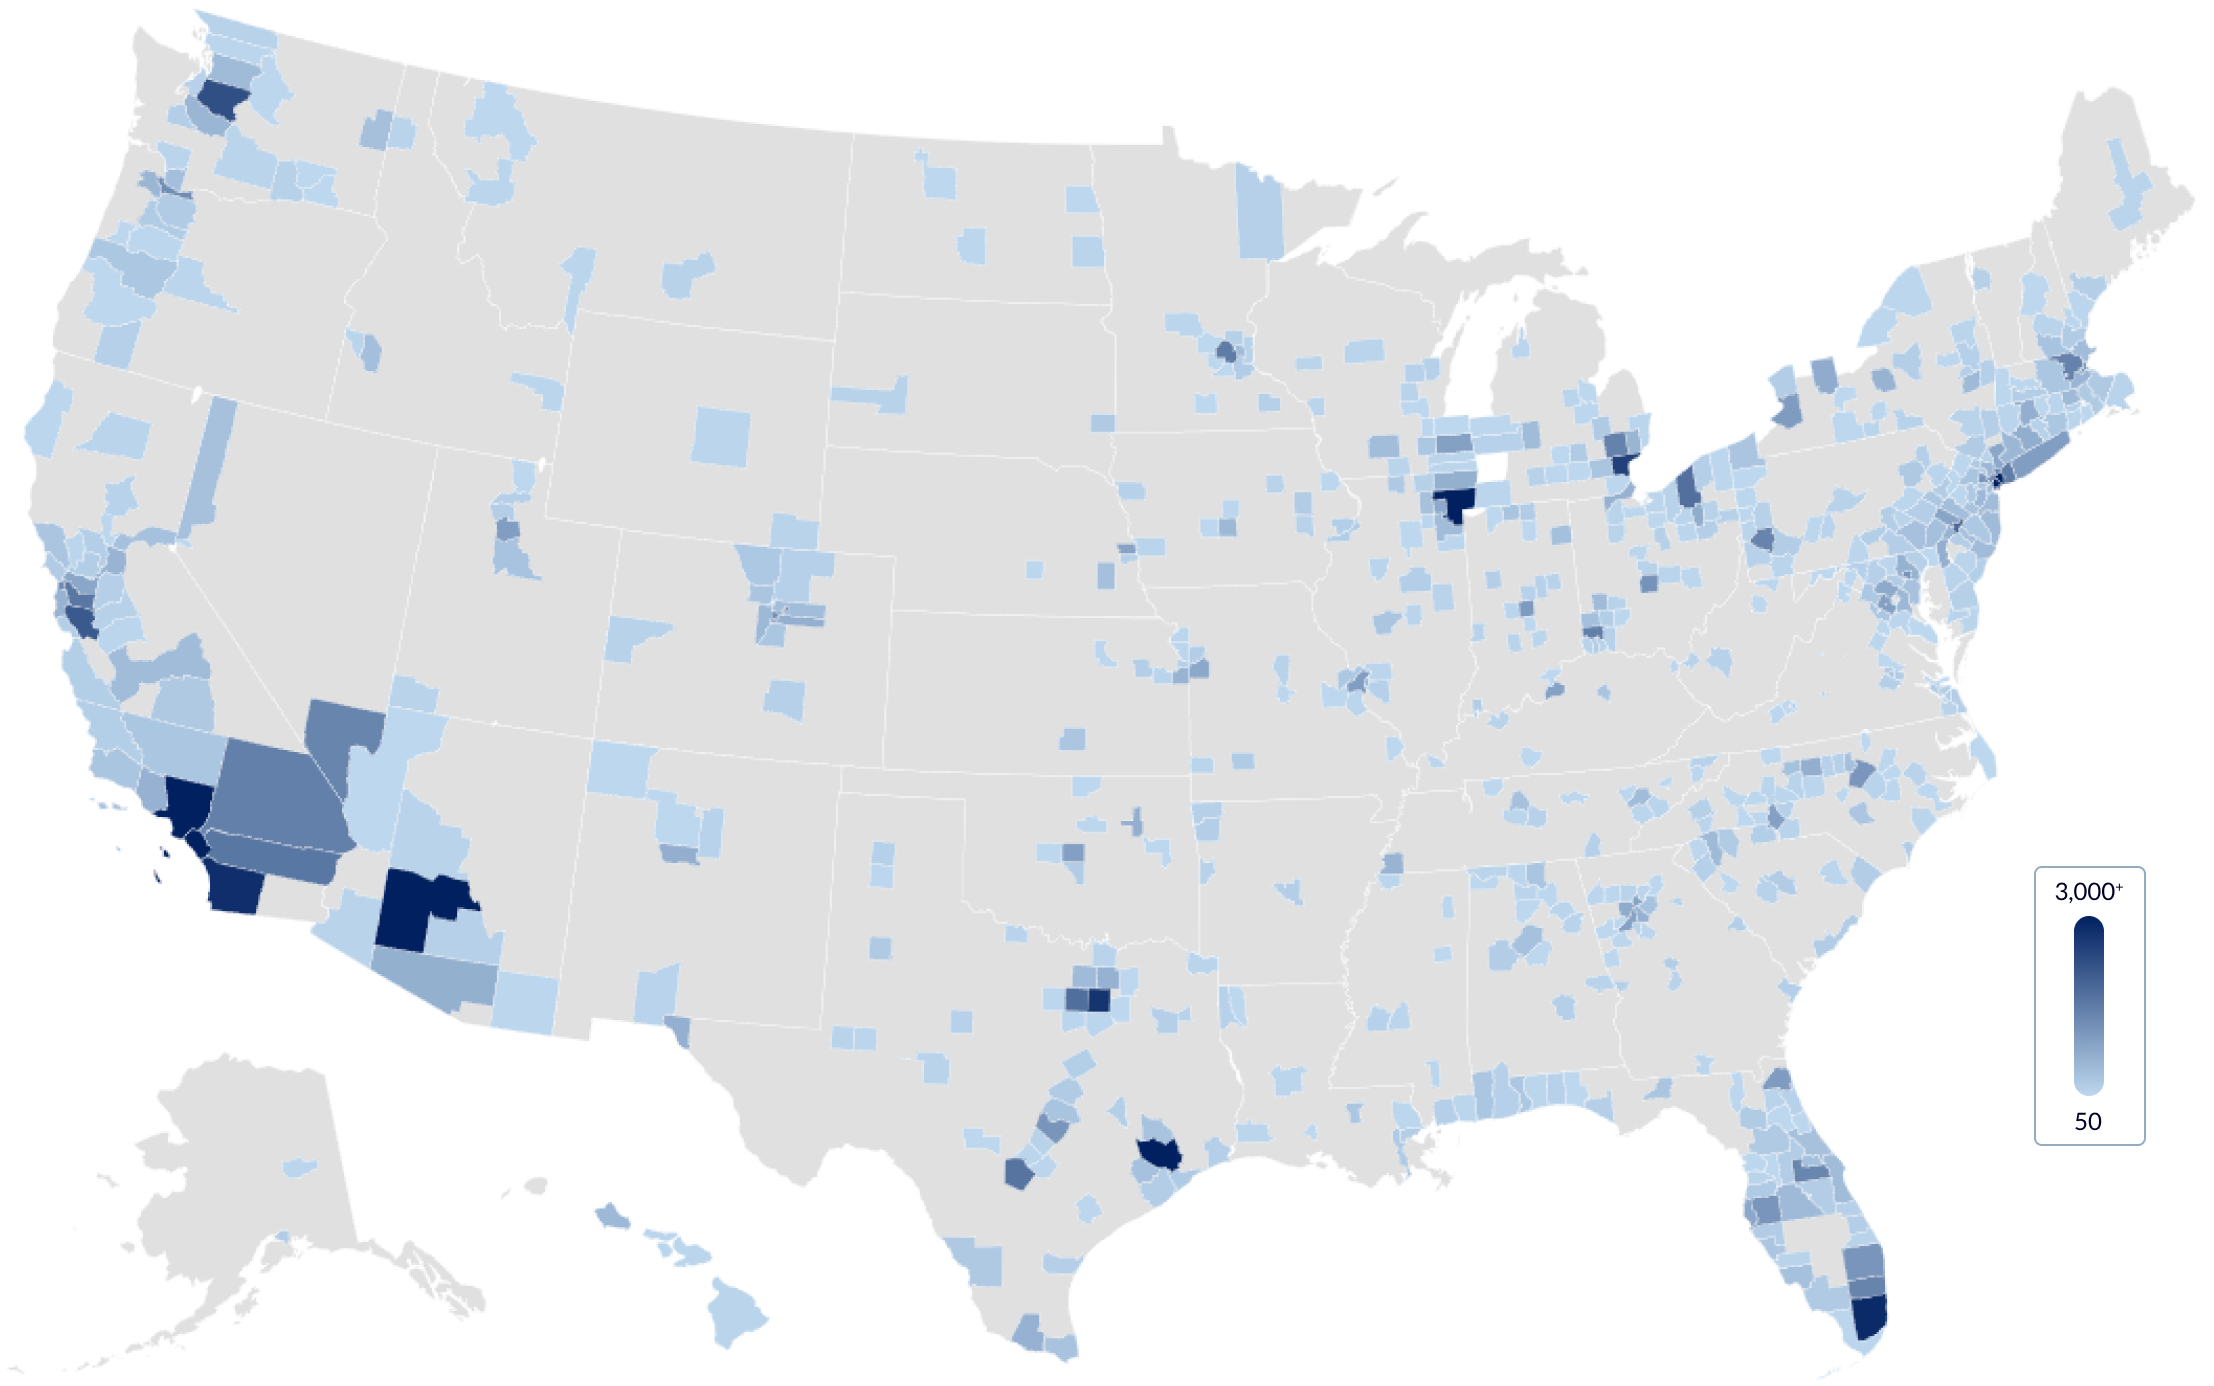
Counties back to top
- 2,443 of the nation’s 3,033 total counties include at least one signal analyzed
- Underscoring the dominance of rural counties, more than half of these counties (1,162) have 10 signals or less
- 47 counties have at least 1,000 signals
- 203 counties have at least 250 signals
- 418 counties have at least 100 signals
While there are currently more than over 253,000 signals mapped in INRIX Signal Analytics, the 2022 Signals Scorecard includes signals that have data across all four data collection weeks
© INRIX, Inc. 2023
Learn More
- Data collection weeks across all seasons in 2022 provides unprecedented insight into arterial roadway demand
- 2022 is arguably the first full post-pandemic calendar year - showing the new-normal baseline demand[1]
Calendar Year 2022, Nationwide
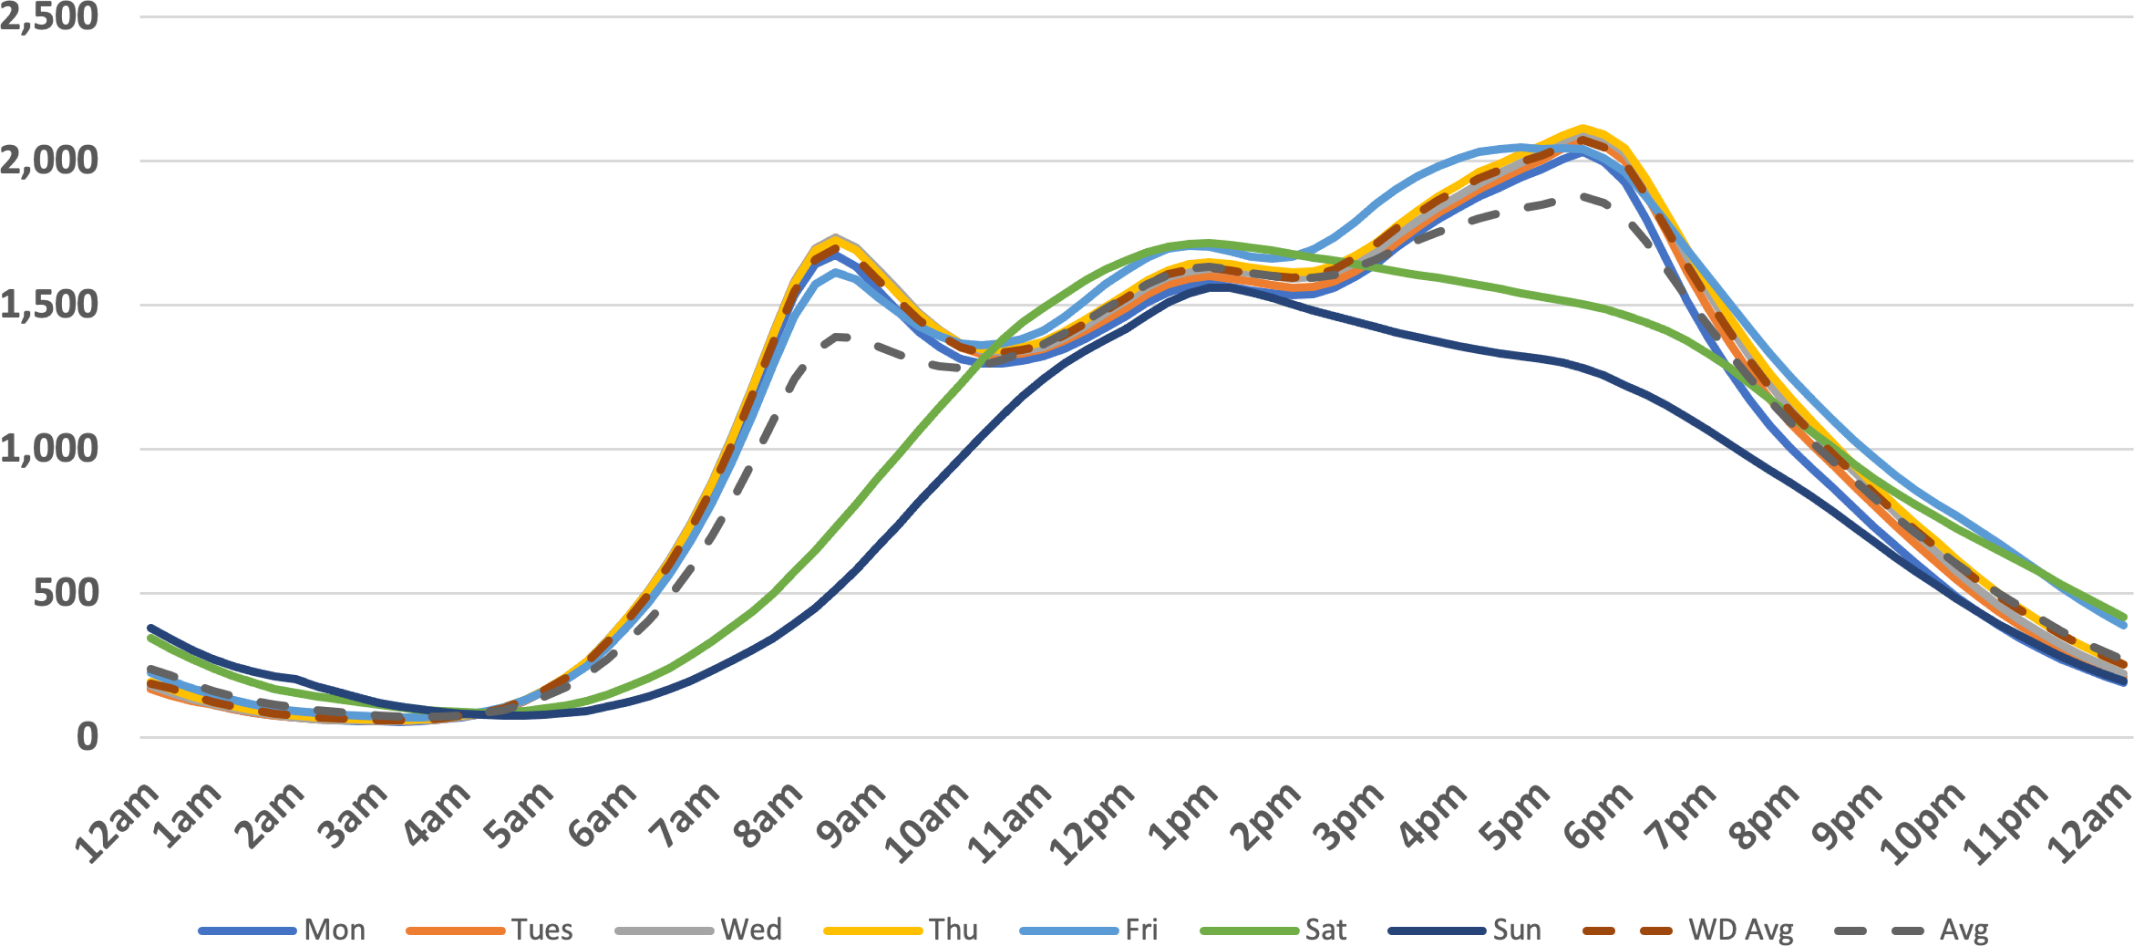
A combination of nearly 5 billion samples across all intersections over the four data collection weeks of 2022 and INRIX’s Volume Profile dataset enable scaling of samples to estimated volumes for each intersection. Samples for all movements at an intersection are counted in 15-minute increments each day of each data collection week then averaged to create a typical week of samples for each intersection in 672 time slices – 15 minutes a day for 7 days. Each intersection is then scaled up to an estimated volume of total vehicles for the typical week.
2022 Intersection Average Daily Traffic (ADT) back to top
- Estimated ADT for Average Signal: 23,308
- Estimated ADT for Median Signal: 19,507
-
Peak Demand Hour by Day:
- Monday - Thursday: 4:30 - 5:30 pm
- Friday: 3:45 - 4:45 pm
- Saturday - Sunday: 11am - 12noon
- Peak Hour Factor decreases as Estimated ADT decreases


Quarter by Quarter Intersection ADT back to top
- All but June's dataset followed similar trends, although the March dataset has a lower AM peak period demand than the September and November datasets
- June had lowest AM peak and highest midday demand, likely due to summer travel patterns
- AM Peak demand hour increased to ~85% of PM peak demand hour the second half of 2022 - TBD is this is the new normal or if it will continue to increase going forward


© INRIX, Inc. 2023
Learn More
-
Scorecard focuses on three primary signal performance metrics:
- Delay/Vehicle
- Arrival on Green
- and Split Failures
- Results are weighted aggregations of all movements at each intersection
Nationwide Delay Per Vehicle back to top


Nationwide Arrival on Green back to top


Nationwide Split Failures back to top


© INRIX, Inc. 2023
Learn More
All analyzed signals are shown on the interactive map below, with the color representing the full week intersection level of service.
Each signal is clickable and the details include:
- Intersection information including intersection name (from Openstreetmaps), the county, state, and MPO (when applicable) the intersection resides; a link is also available to view the intersection in Streetview
- Metrics including daily average observed crossings, and weekly average delay, arrival on green and split failure percentages
- Peak hour data including the day/time, peak hour delay and peak hour factor
View Fullscreen Map
© INRIX, Inc. 2023
Learn More
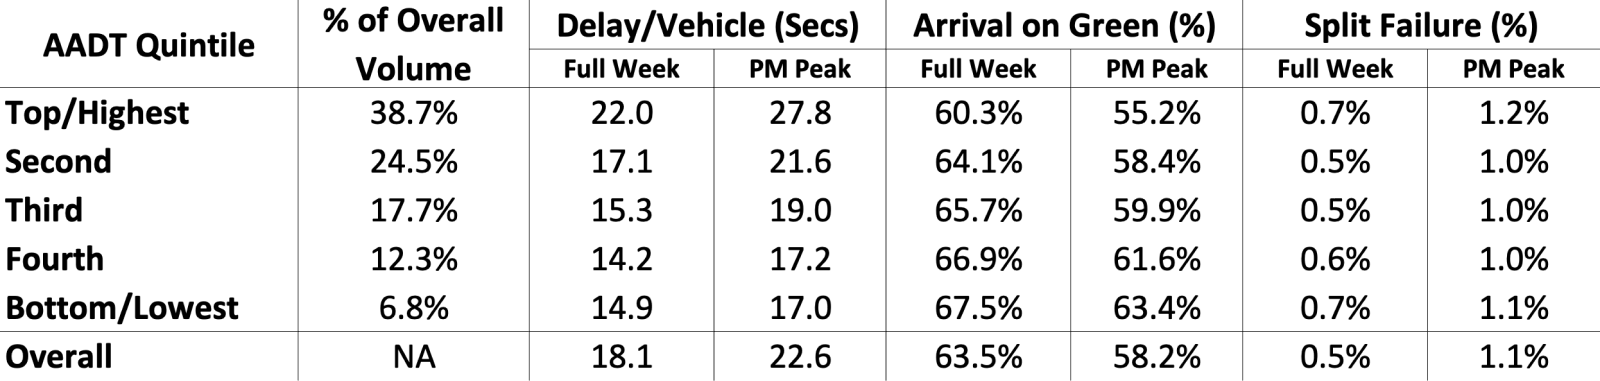
- Summary results are available for nearly 500 geographies (every state, all MPOs (193) and counties (250) with 200+ signals)[1]
- Select region on left, from the list below to view in-depth summaries[2]
For MPOs that span multiple states, the MPO can be selected under each state, with full region results displayed; county results are for full county, not just signals inside an MPO boundary Differences between MPO boundary and county maps could lead to slight differences between signals analyzed
PM Peak Hour Demand
ADT
Delay/Vehicle
Arrival on Green
Split Failure
Quintile
(%)
ADT
icle (Secs)
Green (%)
Failure (%)
in metric tonnes
Use, in Barrels
© INRIX, Inc. 2023
Learn More
Signal Demand and Performance Metrics Generation
The INRIX U.S. Signals Scorecard is created using four steps. The first three steps generate data that powers the INRIX Signal Analytics.[1] The fourth step extracts and tailor’s data to create findings specifically for the Scorecard. These are the same steps followed in previous editions, with the exception that this edition is based upon 4 weeks of data spread throughout 2022, versus a single week previously.
Ingest sufficient, high-quality GPS data back to top
- INRIX has been ingesting anonymous GPS data from connected cars, commercial vehicles, and mobile devices since 2006.
- INRIX now ingests over 15 BILLION GPS readings daily in the United States alone.
- For Signal Analytics, INRIX analyzes over 85% of those readings from connected vehicles, with the best location accuracy and highest update rates. This ensures each individual vehicle’s movement in and around intersections can be analyzed with high confidence.
- For the four weeks utilized in this 2022 Scorecard, we leveraged more than 13.4 billion daily GPS readings.
Convert GPS readings into Trip Paths back to top
- INRIX Trip Analytics translates GPS readings into discrete trips, with origin, destination, route path, date and time stamps, etc. Data is cleaned, filtered, linked, ordered, and snapped to the road network to enable detailed analysis of trip path from start to end of each trip.
- INRIX Trip Analytics generates more than 130 million daily trips traversing over 1.25 billion miles in the U.S. each day, more than 10 billion miles overall in each week.
- INRIX curated over 1.16 BILLION highest quality trips covering more than 10 BILLION miles traveled across the U.S. over the four data collection weeks, to be used in Steps 3 and 4.
Generate Signal Performance Metrics. back to top
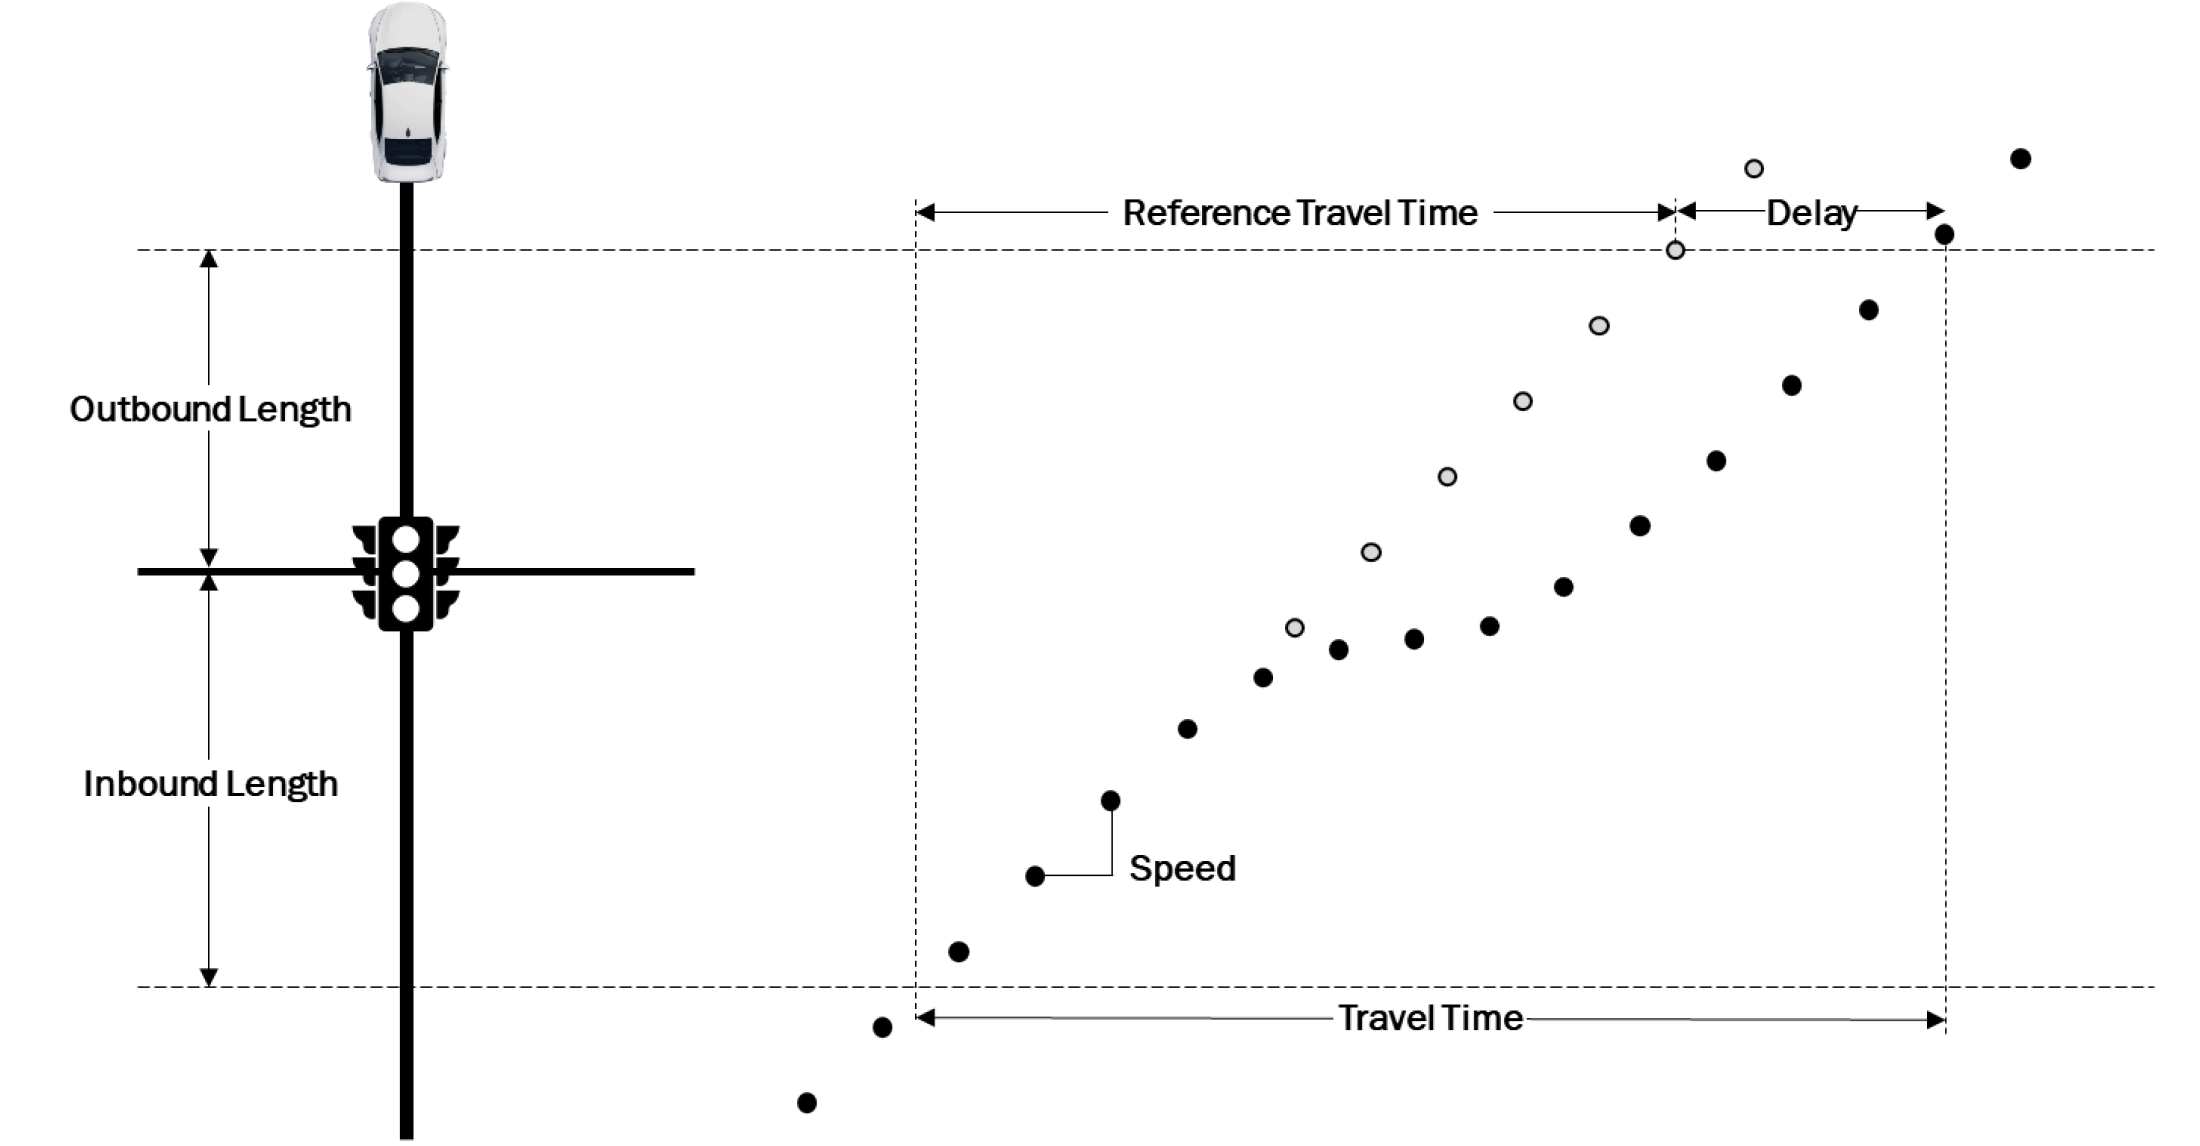
- INRIX Signal Analytics evaluates each individual trip as it moves through a known signalized intersection, creating a log of each vehicle/intersection interaction to enable aggregation of several metrics typically utilized to assess signal performance.
- Key information logged includes day/time stamp, turning movement, stops, and total travel time through the intersection.[2]
- Signal Analytics presently covers over 253,000 signalized intersections in the U.S., with data at the movement, approach, and intersection level.
- Key for overall analysis and this Scorecard is that this approach enables analysis of all movements and approaches at an intersection and, over enough time, the random samples generated by the INRIX Signal Analytics Fleet will mirror overall demand and performance at the intersection.
- INRIX Signal Analytics aggregates metrics at the movement, approach, and intersection level for each intersection. For this Scorecard, data has been aggregated at the intersection level. The figure below illustrates how movement level metrics results in weighted average intersection level metrics.
Scorecard back to top
- Data was extracted in 15-minute increments for each intersection for the full weeks of March 21-27, June 13-19, September 19-25, and November 1-7, 2022 (a week in each calendar quarter). An average week was then created from these four weeks.
- Thus, for each metric, there were 672 different results (4/hour x 24 hours x 7 days) for each of 242,757 intersections across the U.S (signals for which data is available across all four weeks).
- Metrics extracted and used for this Scorecard are the number of observed vehicle crossings, average control delay per vehicle, arrival on green percentages, and split failure counts and percentages.
- INRIX Volume Profiles[3] was used to estimate the penetration rate of the observed results at each intersection, to scale up results to represent total estimated intersection average daily traffic.
- Intersection scale factors enable total delay calculations and weighted averages for arrival on green percentage and delay/vehicle calculations for intersections rolled up by state, county and MPO.[4]
- Data was extracted one state at a time and local time is used in all cases. When a state has more than a single time zone, the prevalent time zone is used for all data across the state (e.g., Florida is computed in Eastern Daylight Time).
https://inrix.com/products/signal-analytics/
An explanation of the processes used to create these metrics is here: https://docs.inrix.com/signals/metrics/
https://inrix.com/products/volume/
MPO boundaries were derived from this file: https://hepgis.fhwa.dot.gov/fhwagis/
Zipfiles/MPO_Boundary_01072022.zip
Signal Delay Emissions and Fuel Use Impact Estimation Methodology back to top
The FHWA Congestion Mitigation and Air Quality Improvement (CMAQ) Program released an Emissions Calculator Toolkit[5] for use by agencies to estimate air quality benefits. As part of that toolkit, an intersection improvements module was created that uses the emissions rates from national level runs of the EPA Motor Vehicle Emission Simulator (MOVES).[6] Leveraging the intersections module within the CMAQ toolkit, a green calculator was created to estimate the amount of fuel and CO2 equivalents produced at signalized intersections due to idling.
The calculator uses the following:
- Assumed Fleet Year - Fleet year used in the EPA Moves Model
- Vehicle Volume - The amount of vehicles that cross an intersection or series of intersections
- Percentage of Heavy-Duty Trucks - The percentage of heavy-duty vehicles
- Initial Average Control Delay - The initial average delay vehicles experience as a result of the signalized intersection(s).
- Final Average Control Delay - The final average delay vehicles experience as a result of the signalized intersection(s).
- Urban or Rural Environment - The location of the signalized intersections of interest
The calculator uses these inputs to determine the following:
- Total Hours Saved - The total vehicle hours impacted by the change in average control delay. Mathematically this is the difference between the initial average control delay and the final average control delay, multiplied by the vehicle volume. This number can be scaled as a daily, weekly, monthly, or annual number.
- Carbon Dioxide Equivalents - The total number of hours saved is used along with the EPA MOVES emissions rates to determine the CO2 equivalents.
- Total Fuel Savings - The total number of hours saved is used along with the EPA MOVES emissions rates to determine the energy consumption.
The process to estimate standard conversions between delay, emissions, and fuel consumes in the U.S. Signals Scorecard is based on the following assumptions.
- 3.24% Heavy Vehicles - Using the USDOT Bureau of Transportation Statistics approximately 3.24% of VMT outside of interstates could be considered 'heavy duty vehicles'
- 2023 Fleet - The 2023 fleet was used in the EPA MOVES model
- 1 gallon of fuel is equivalent to 120,286 BTU (US Energy Information Administration)
Using these assumptions, with the calculator methodology defined above, it was determined 1 hour of vehicle delay at signalized intersections in the U.S. would amount to 7.43 pounds of CO2 and approximately 0.37 gallons of fuel.
Toolkit - CMAQ - Air Quality - Environment - FHWA (dot.gov)
Intersection Improvements Module - Toolkit - CMAQ - Air Quality - Environment - FHWA (dot.gov)
Documentation of Emissions Data for the Traffic Flow Improvements Tool - Toolkit - CMAQ - Air Quality - Environment - FHWA (dot.gov)
MOVES and Other Mobile Source Emissions Models | US EPA
© INRIX, Inc. 2023
Learn More
- INRIX Signal Analytics uses OpenStreetMap (OSM) data to identify signalized intersections
- Not all signals in the US are tagged in OSM. Estimates are as many as 100,000 are yet to be tagged
- OSM is crowd sourced, thus anyone can add signals to OSM, including you
- Any signals adding will be included in future signal scorecard updates
- The video below provides instructions to add signals, which will in turn allow us to provide a more complete picture of demand and performance in your region
© INRIX, Inc. 2023
Do you manage signals and would like more details about them specifically? Let us know what agency you work for and we'll send more details about the signals you mange.