


Today, INRIX released its 2021 Global Traffic Scorecard, providing new insights into changing travel patterns resulting from the supply chain disruption, Delta variant, vaccine rollouts, fuel price increases and resuming social and event gatherings.
In short, the Scorecard reveals a significant rebound in traffic, though not as bad as 2019. London topped the global list this year at 148 hours, coming in just shy of the 149 hours drivers spent in congestion pre-COVID. Paris follows at 140 hours, while Brussels rounds out to the top 3 at 134 hours. In general, rebounding economies across much of North America and Europe have driven the increase in traffic over last year.
That’s especially true in London, which has seen a significant recovery from COVID-19, resulting in a significant boost to travel demand.
New York, the most congested urban area in the U.S., clocks in at 102 hours lost per driver, down -27% from 2019 levels. Only a few urban areas exceeded 2019 levels of traffic, notably Las Vegas, NV. I-15 has been significantly congested, somewhat based on an influx from tourism from California to Nevada. The Las Vegas Convention and Visitor’s Authority states volumes of cars crossing the CA-NV Border are up 11% over pre-COVID levels, despite airlines seeing a moderate decline in passengers. Transportation officials are also adding strategic capacity and retrofitting current infrastructure for safety, yet temporarily adding to backups.
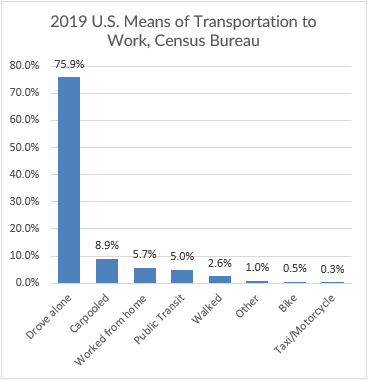
Telecommuting has continued to its hold as a major commute mode. Prior to the pandemic, the U.S. had a telecommuting mode share of 5.7%. Remote working has continued to grow year over year, ultimately surpassing transit as the third highest commute mode share.
Yet just a week ago, the Census Bureau went a step further and released their 2020 estimates on November 30, 2021. They urged caution on the results, as Census data collections were hampered significantly due to the COVID-19 pandemic.
But Demographers wasted no time in analyzing the latest data provided by the Census. One demographer, Wendell Cox, estimated Working from Home reached an 18.7% commute mode share nationwide, a 212% change in commuting to the living room/home office. While all other modes to work decreased, unsurprisingly transit – which tends to serves commuters – fell the most with a -42.8% drop.
Using those same assumptions, he estimated the following work from home shares by state as well.
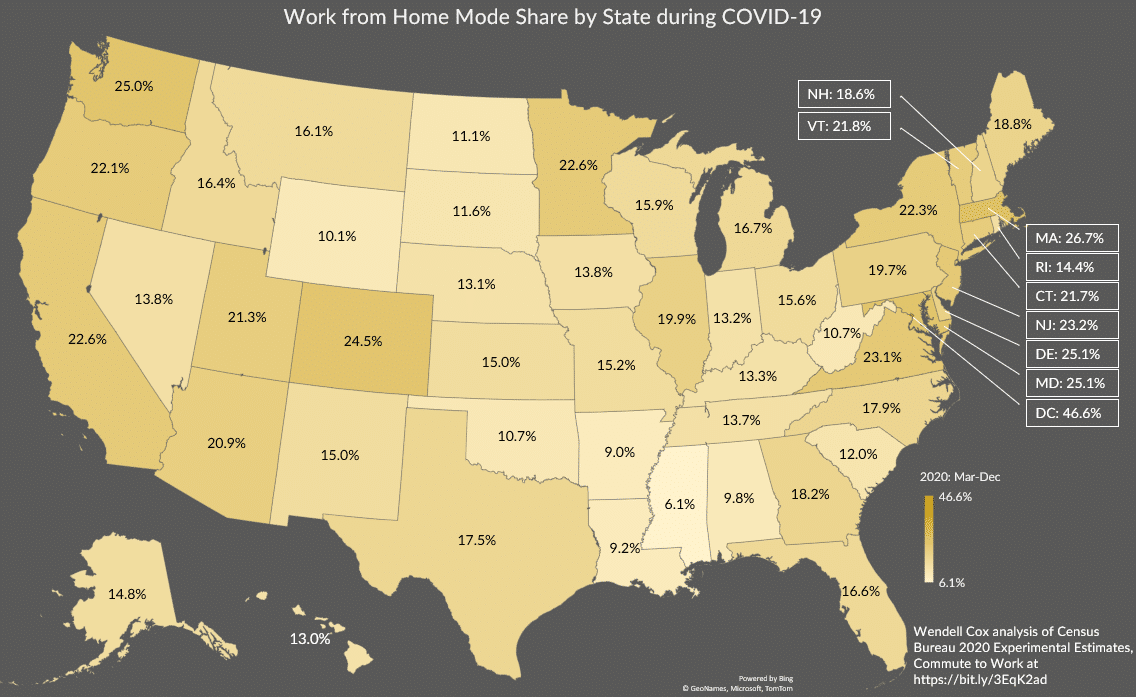
Unsurprisingly, coastal states (excluding Alaska and Hawaii) tended to have the largest working from share, as they are home to largest cities and Central Business Districts. Washington DC had the highest work from home commute share at 46.6%, contributing significantly to its 65% reduction in delay compared to 2019. DC telecommuting rates are high due to local economy, large government presence and the small size of the city/district proper. The South and Midwest tended to have fewer people working from home than coastal states
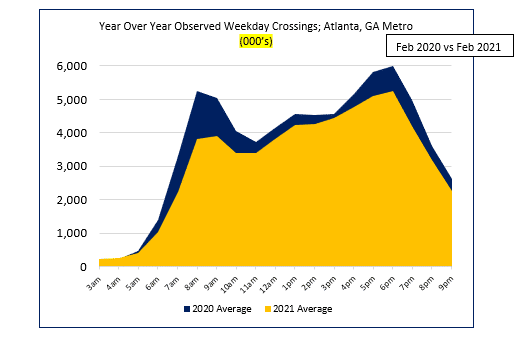
And the trend may continue. Recent studies have suggested that nearly 1 in 4 workdays will be performed at home post-pandemic, up from 1 in 20 pre-pandemic, which will result to changes on the roadway. INRIX noted this trend early on based on our traffic signal data. In Atlanta, for example, year over year crossings at intersections decreased by -26% during the morning commute period but fell just -8% during the mid-day period. This change in travel behavior has remained constant throughout the pandemic, suggesting travel shifting away from work-related trips toward other trip purposes, like recreational and retail shopping.
Telecommuting trends will stick even post-pandemic. While congestion will continue to build on our roadways, travel patterns will continue to evolve and require flexibility on the part of the public, employers and transportation officials to maximize our infrastructure and keep people moving. Transportation agencies played a key role during the pandemic – often taking advantage of lower-than-average traffic volumes to attack much needed maintenance and preservation.
Though drivers are probably a little happy that congestion is not as bad as before COVID-19, the larger concern about safety should raise alarms. Traffic fatality rates continued their trend during the pandemic. While many countries in Western Europe reported fewer fatalities on streets and motorways, early estimates from the U.S. National Highway Traffic Safety Administration show that January to June 2021 recorded the largest six month fatality increase in history, an 18.4% jump over 2020. They site behavioral research that indicates increases in speeding and traveling without using a seatbelt as potential incidents that have led to higher injury rates.
Into 2022, there lies enormous opportunity to improve our transportation system, especially with recent increases in infrastructure spending. Whether through technology, road redesign, repair or maintenance, reducing lives lost to traffic crashes and incidents should be top priority. Though telecommuting may have provided some much needed congestion relief on our roads, serious injuries and fatalities are hurting communities across the country.