


Investors, businesses, and transportation professionals are facing a wave of uncertainty as global trade policy continues to shift rapidly and often without warning.
The U.S. has introduced broad tariffs on Chinese imports while intensifying pressure at both the U.S.–Mexico and U.S.–Canada borders. These moves, aimed at strengthening national competitiveness and securing supply chains, are creating operational friction, pricing volatility, and strategic confusion across a wide range of industries.
At the southern border, freight slowdowns have been triggered by heightened customs inspections, staffing reallocations related to immigration processing, and increased scrutiny of goods suspected of circumventing tariffs via Mexico. On the northern border, tightened review of semiconductor and technology-related imports and closer policy coordination with U.S. trade strategy have added new uncertainty for manufacturers and cross-border operators.
Tariffs on Chinese goods are already raising input costs, particularly in consumer-facing sectors that rely on just-in-time inventory and Asian manufacturing. And while a recent 90-day pause on new tariff actions provided a temporary sense of stability, that relief was short-lived — the U.S. quickly followed with a global ban on Huawei’s Ascend AI chips, reintroducing doubt about the direction and durability of U.S.–China trade relations.
These developments aren’t just policy headlines — they’re actively disrupting how goods move, how companies plan, and how investors price risk.
The challenge now is knowing how to respond.
Traditional indicators come too late. Earnings calls, customs data, and economic reports lag the reality on the ground. But connected vehicle data offers something different:
timely visibility into how companies are adjusting — at ports, borders, warehouses, and distribution centers — as the disruption unfolds.
Connected Vehicle Data: A Timely Lens Into Economic Activity
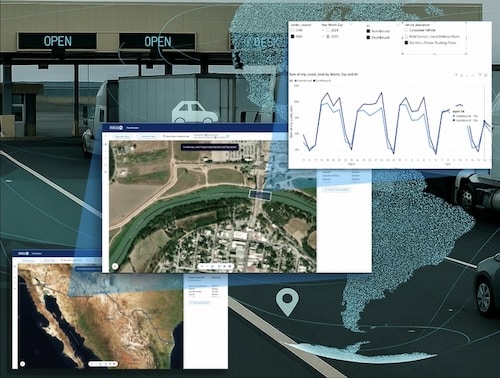
One of the clearest ways to observe the effects of trade and policy changes is by analyzing connected vehicle data — high-frequency, anonymized GPS movement from millions of commercial and consumer vehicles.
Because vehicle movement reflects operational behavior — truck departures from ports, deliveries to warehouses, visits to manufacturing plants — it reveals economic changes in near real time, before those changes are reflected in financials or official reports.
Connected vehicle data offers timely insight into:
- Freight slowdowns or bottlenecks at ports and border crossings
- Inventory behavior at retail or industrial distribution centers
- Routing changes due to policy, cost, or customs delays
- Consumer demand shifts based on retail site traffic
For investors, retailers, and supply chain professionals, this type of data provides a new layer of market intelligence that complements traditional financial reporting.
How INRIX Data Helps Monitor Trade and Policy Impacts
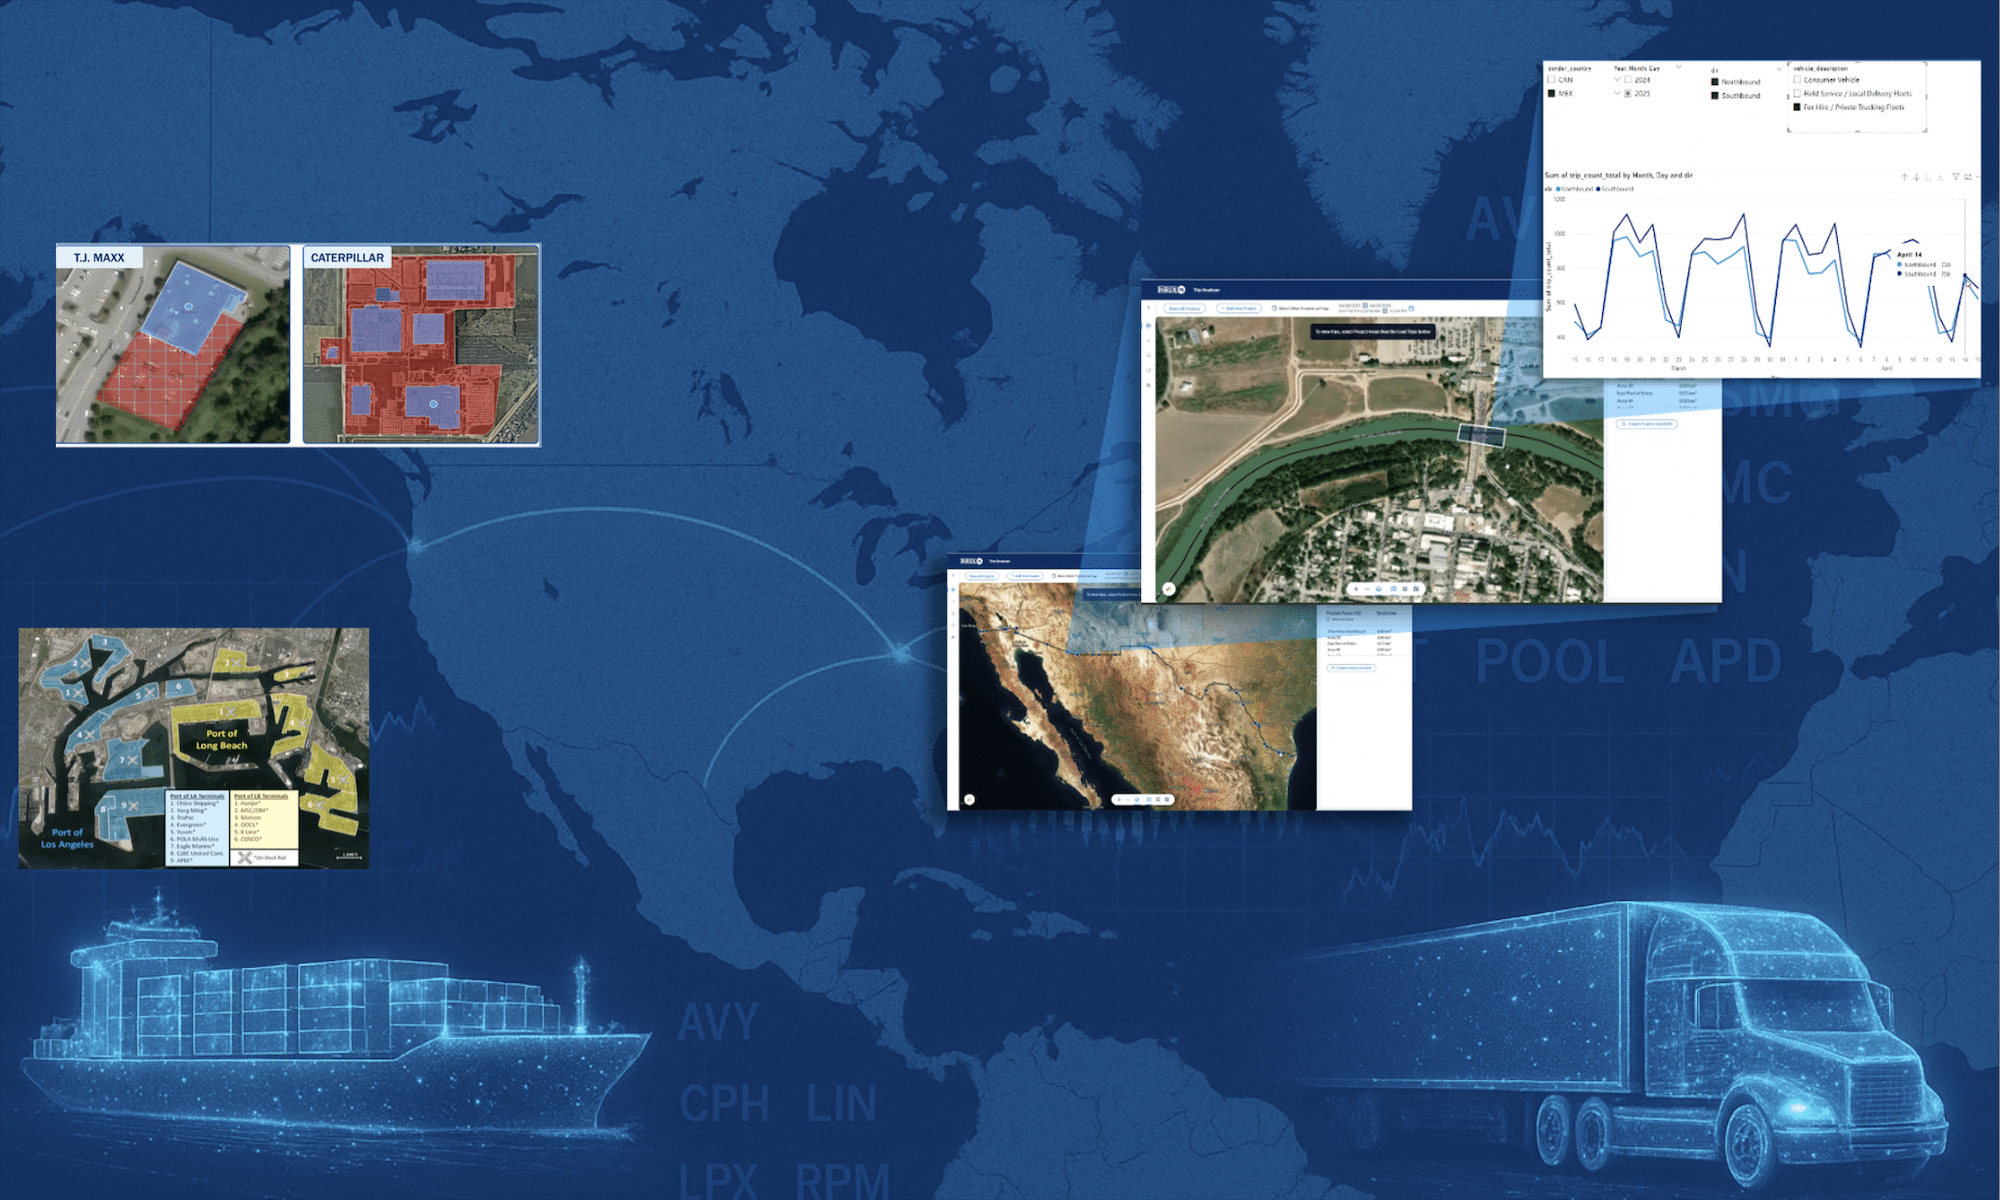
INRIX delivers a suite of alternative data solutions designed to help institutional investors, hedge funds, and logistics stakeholders monitor economic activity, identify risk, and quantify trade exposure as it unfolds. Each product offers a unique lens on vehicle movement — from macro freight patterns to company-specific demand signals.
Together, they provide a multi-layered, data-driven view of real-world economic behavior.
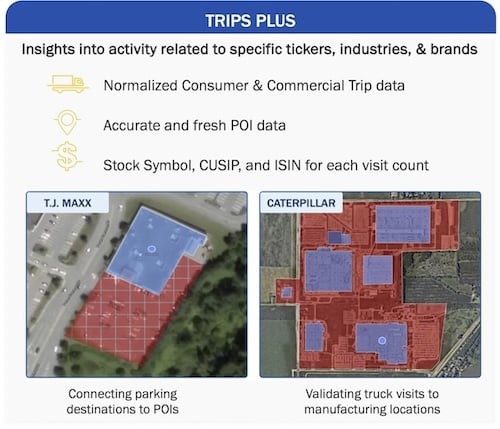
INRIX Trips Plus
Quickly Analyze Companies You Care About
Trips Plus is a first-to-market dataset that combines connected vehicle movement with U.S. private and publicly tickerized POI (point-of-interest) data — helping investors assess activity around specific retailers, brands, and suppliers.
Key Highlights:
- 500+ public tickers and private companies mapped to 11M+ U.S. POIs
- Covers both consumer and commercial vehicle trips
- High-resolution metrics: origin-destination, vehicle type, distance, and duration
- Clean, de-duplicated POI metadata (location names, brands, and categories)
- Covers 14% of all U.S. Vehicle Miles Traveled (VMT)
Use Case:
Monitor trip counts to warehouses, distribution centers, or stores to identify inventory buildups, shipping slowdowns, or surges in demand — tied directly to the companies you’re tracking.
INRIX Trips Data (API)
Query Deep Movement Patterns with Custom Flexibility
The Trips API provides access to anonymized, raw trip-level data, enabling custom queries around commercial and consumer vehicle movement near ports, retail hubs, highways, or logistics corridors.
Key Highlights:
- 150M+ anonymized vehicle trips captured daily
- GPS ping data captured every 3–5 seconds for high spatial and temporal fidelity
- Transparent methodology and clearly defined metrics
- Data refreshed daily for up-to-date insights
Use Case:
Analyze commercial vehicle trends around high-volume freight nodes. For example, track how truck activity near the Port of LA fluctuates week-over-week after new tariffs go into effect — helping you detect early signals of congestion, inventory strain, or routing adjustments.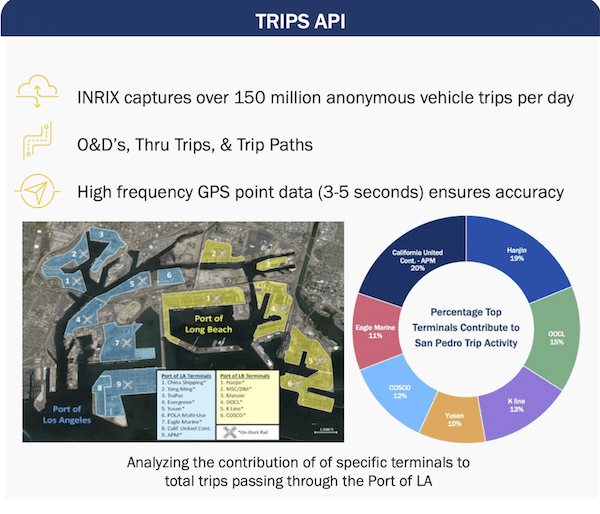
INRIX Cross Border Insights
Trade Intelligence at U.S. Borders
INRIX Cross Border Insights delivers directional, observed probe count data segmented by vehicle type for every major U.S.–Mexico and U.S.–Canada land border crossing. This dataset fills a critical visibility gap for investors and supply chain leaders seeking to monitor the real-world movement of goods and people across borders.
Key Highlights:
- Covers 140+ U.S. border crossings
Directional flow tracking: northbound vs. southbound - Vehicle-type segmentation: commercial vs. consumer
- Granular insights at the crossing level to detect anomalies or rerouting
Use Case:
Monitor how new tariffs or inspection policies are affecting freight flows. For instance, a drop in commercial truck traffic at Laredo may indicate sourcing disruptions for auto parts or produce, while a spike in consumer traffic at Otay Mesa could point to grey-market demand.
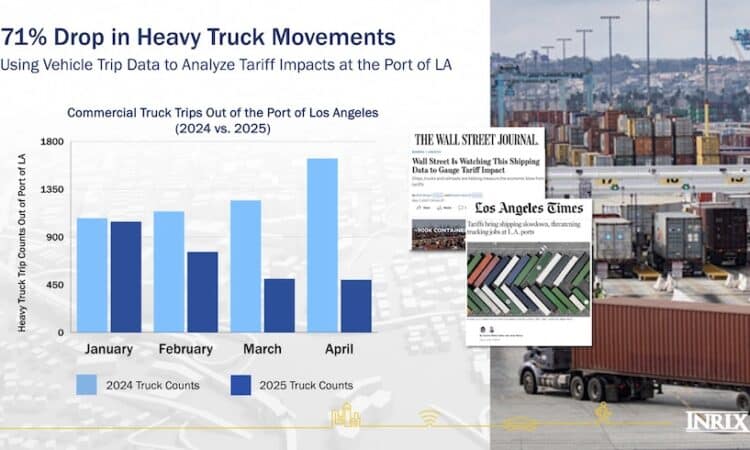
What We’re Seeing: A Massive Drop in Outbound Heavy-Truck Movement at Critical U.S. Port
The Port of Los Angeles is one of the largest U.S. gateways for Chinese imports, including high-volume categories like electronics, apparel, and furniture. As such, it’s one of the most critical infrastructure nodes for understanding the impact of Chinese tariffs on U.S. supply chains.
In April, Port Director Gene Seroka warned:
“We could see a 35% drop in shipping volume next week as the tariffs take hold.”
— CNBC, April 29, 2025
INRIX data confirmed that the slowdown was already underway:
Between January and April, heavy truck trips leaving the Port of LA dropped 71% year-over-year — a dramatic pullback suggesting reduced import flow, delayed shipments, or rerouting efforts in anticipation of rising costs.
To validate the downstream effect, INRIX also analyzed heavy-truck activity at a major IKEA distribution center in Southern California — a facility that supports regional fulfillment and sources a significant portion of its inventory from China.
Our Trips data showed a corresponding 70% drop in commercial vehicle visits to the IKEA distribution center in Q1 2025 compared to the same time period 2024, aligning closely with the timeline of the Port’s decline and the tariff announcements.
This case illustrates how connected vehicle data can provide cohesive macro-to-micro visibility — showing how national policy changes impact both infrastructure hubs and individual company behavior in near real time.
Industries Most Affected by Tariff-Driven Disruption
The impact of trade policy changes — particularly tariffs on Chinese goods and increased border scrutiny — is not evenly distributed. Certain industries are especially exposed due to their reliance on imported materials, components, or finished products, as well as their dependence on efficient, just-in-time logistics networks.
Here are the sectors most affected and how connected vehicle data can reveal early signs of disruption:
Retail & Big Box (Walmart, Target, Best Buy)
These retailers rely heavily on low-cost imports from Asia — especially for general merchandise, seasonal goods, and consumer electronics. A slowdown in truck traffic at distribution centers or major intermodal hubs may signal inventory delays, reduced throughput, or stockpiling activity. Monitoring these changes can offer timely clues into operational stress and potential impacts on margins and sales performance.
Apparel & Footwear (Nike, VF Corp, Gap)
The apparel industry is deeply integrated with Chinese and Southeast Asian manufacturing. Most finished goods are shipped through West Coast ports like Los Angeles and Long Beach. Disruptions in freight flow — especially at fulfillment centers or last-mile distribution nodes — can indicate sourcing challenges or delayed replenishment. Because fashion relies on speed and seasonality, even minor logistical friction can cause inventory imbalances or missed revenue windows.
Home Goods & Furnishings (Wayfair, IKEA Distribution Centers, Home Depot)
Furniture, appliances, and home improvement goods are among the most tariff-sensitive product categories. These companies operate large-scale fulfillment centers across regions. A drop in truck traffic to these sites may reflect deferred shipments, cost-based sourcing changes, or shifts in inventory strategy — all of which have implications for consumer demand and margin pressure.
Consumer Packaged Goods (P&G, Clorox, Scotts Miracle-Gro)
While many CPG products are produced domestically, key inputs and packaging materials are often imported. Monitoring cross-border traffic and port-based deliveries helps surface early signs of production risk, especially for time-sensitive or seasonal goods.
Construction Materials & Chemicals (Vulcan, Martin Marietta, RPM, LIN, APD)
Heavy industries are highly dependent on cross-border material flows from Mexico and Canada. Disruptions here can delay infrastructure and commercial projects. With INRIX Cross Border Insights, stakeholders can spot movement shifts that might otherwise go undetected until delivery timelines slip or procurement costs rise.
The Bottom Line
As protectionist trade policies evolve, supply chains are under constant pressure to adapt. For investors and operators, connected vehicle data delivers a timely, infrastructure-based view of market activity — helping translate policy headlines into actionable signals.
While tariffs may be paused, uncertain, or escalating — freight does not lie.
Watching the movement of goods tells the story of what’s happening in real terms.
Get a Closer Look
Want to explore how connected vehicle data can help you anticipate supply chain risk, monitor border flow, and track disruption before it hits earnings?
Request a free demo of our solutions like Trips Plus, Trips API, or Cross Border Insights solutions.