


When transportation agencies implement innovative solutions, the journey from problem identification to successful operations often spans years and involves multiple teams.
The Ohio Department of Transportation’s (ODOT) I-670 SmartLane project in Columbus provides a compelling case study of how data-driven decision making can transform this process—creating faster, more targeted solutions to transportation challenges.
In our previous post, we explored, at a high level, how ODOT leverages INRIX data across their organization. Now, we take a zoomed-in look at a single project to see how INRIX data supported each phase of development—from initial problem identification through performance validation, and everything in between.
Finding the Problem: Statewide Analysis Reveals the Issue
No surprise — the I-670 SmartLane story begins with data. , ODOT used INRIX historical traffic data to identify the most congested and unreliable corridors across Ohio’s highway network. The ATDM study, which prioritized improving travel time reliability and preserving reliable capacity for the future, evaluated all Ohio urban corridors according to congestion severity, physical characteristics, and potential for improvement.
The INRIX data showed ODOT that I-670 has a peak-hour congestion problem, with particularly unreliable PM rush hour traffic leaving downtown towards the airport. Commutes could vary between 10 and 20 minutes on the same 4-mile stretch during afternoon rush hour.
Designing the Right Solution: Data-Informed Planning
With the corridor identified, ODOT’s team needed to determine the exact operational parameters for a potential hard shoulder running system. Along with other feasibility analyses, ODOT used INRIX historical data to analyze:
- Typical congestion start and end times
- Speed differentials throughout the corridor
- Travel time reliability patterns
- Adjacent corridor impacts
The data confirmed that a hard shoulder running solution offering an additional eastbound lane during afternoon peak periods could significantly address the problem at a fraction of the cost of traditional widening.
ODOT went through its planning process to design an ITS footprint with the right mix of technology:
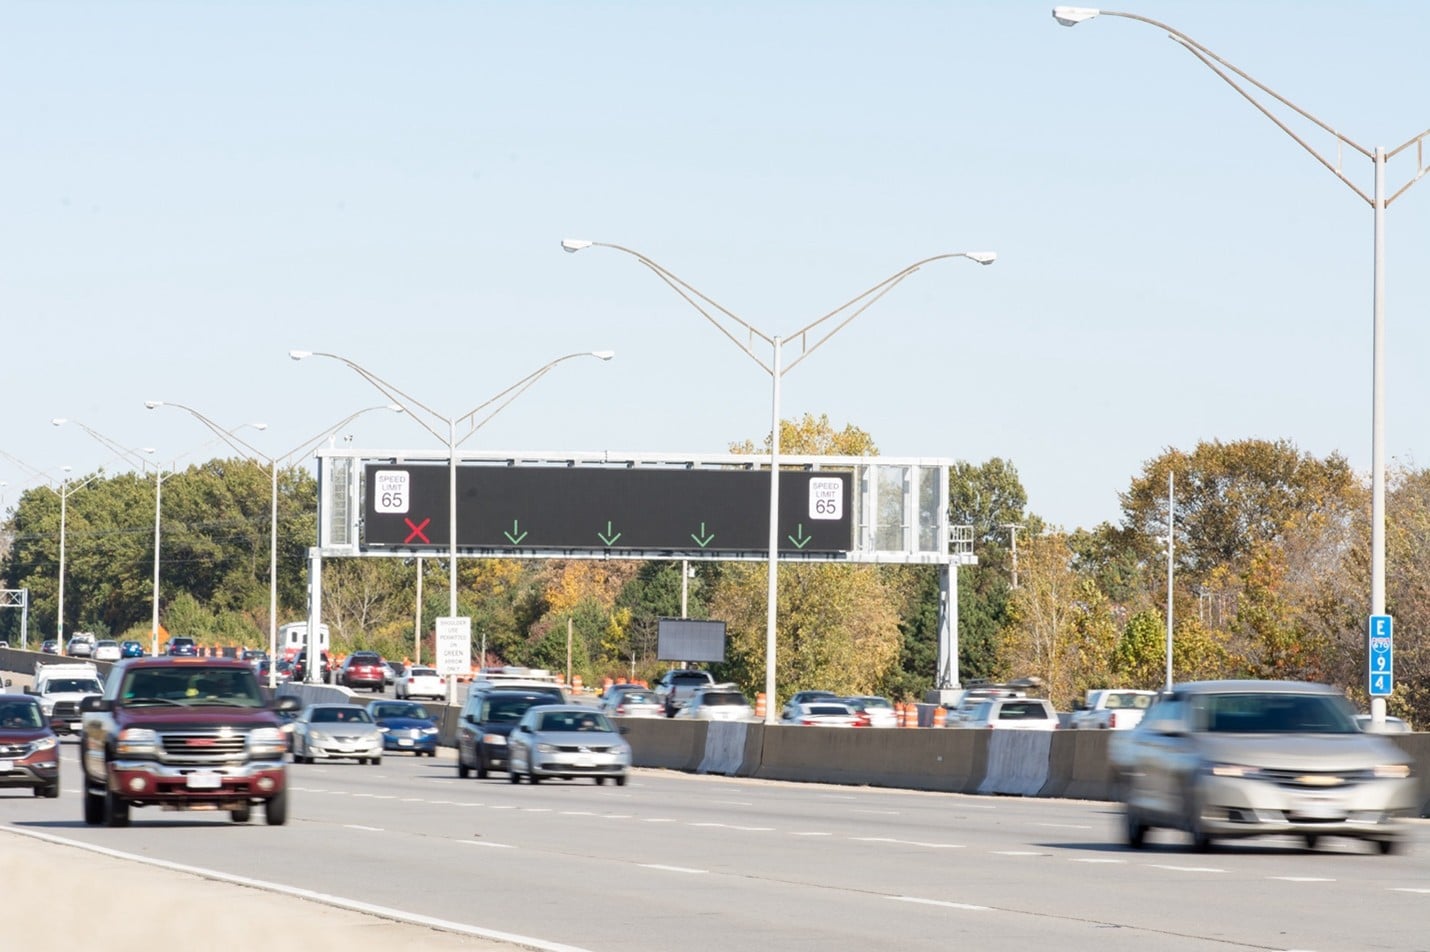
- Overhead lane control signs
- Dynamic message boards
- Traffic monitoring cameras
- Speed sensors
Monitoring Construction Impact
When construction began, ODOT didn’t stop using INRIX data. Instead, they leveraged it to monitor how construction activities were impacting travelers through the corridor.
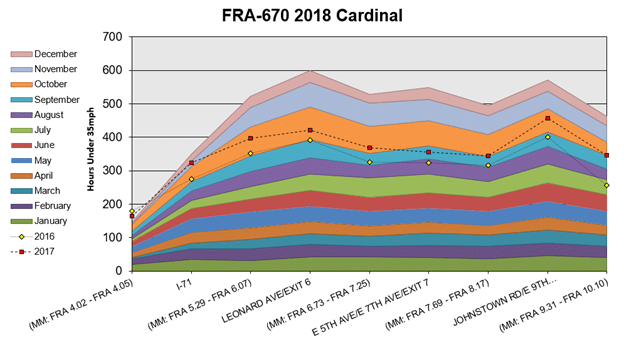
The “volcano- gram” visualization above, powered by INRIX data, helped ODOT’s construction teams understand the impact of various work zone configurations on traffic flow. By comparing real-time conditions against historical baselines, ODOT could identify when construction activities were creating unexpected delays and adjust accordingly.
Testing and Refining: Initial Operations
As the physical infrastructure neared completion, ODOT moved into the testing phase and closely monitored initial operations. Early results revealed an important pattern: when the shoulder lane was opened with a 45-mph speed limit, actual traffic speeds were consistently above 60 mph.
This insight, paired with engineering analysis of the corridor, led to an important operational adjustment. Rather than maintaining the 45-mph limit, ODOT revised their standard operating procedures to set the speed limit at 55 mph when the shoulder lane is in operation – better matching the natural traffic flow while still maintaining safety.
Daily Operations: Real-Time Traffic Management
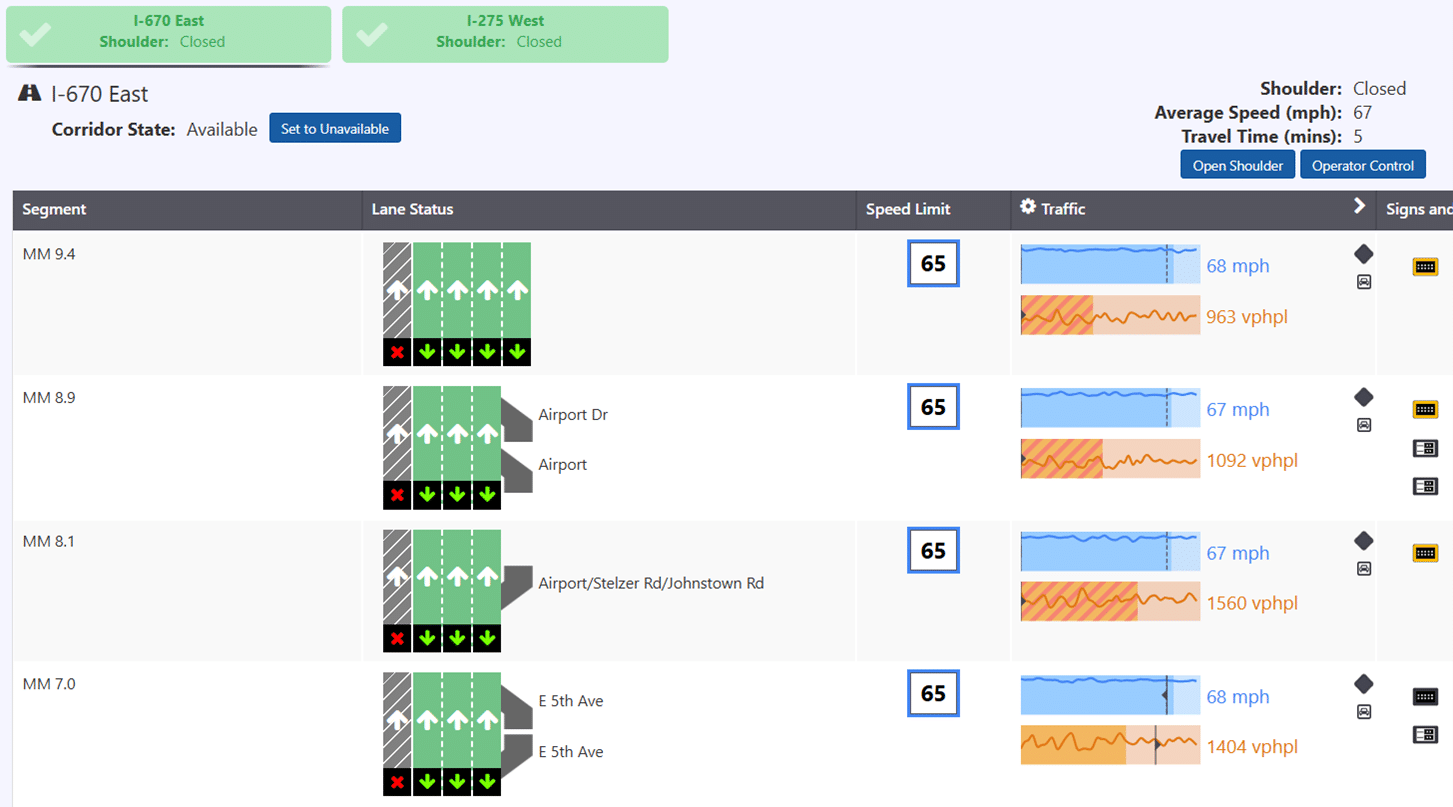
Today, the I-670 SmartLane is managed by ODOT’s Traffic Management Center, where TMC staff monitor real-time speed data integrated directly into their Advanced Traffic Management System (ATMS). This integration gives operators immediate visibility into corridor conditions, helping them make informed decisions about when to open and close the shoulder lane.
Measuring Success: The Proof is in the Data
Perhaps the most compelling part of the I-670 SmartLane story is the measurable improvement in travel conditions. Using INRIX data, ODOT conducted a convincing before-and-after study to quantify the project’s impact.
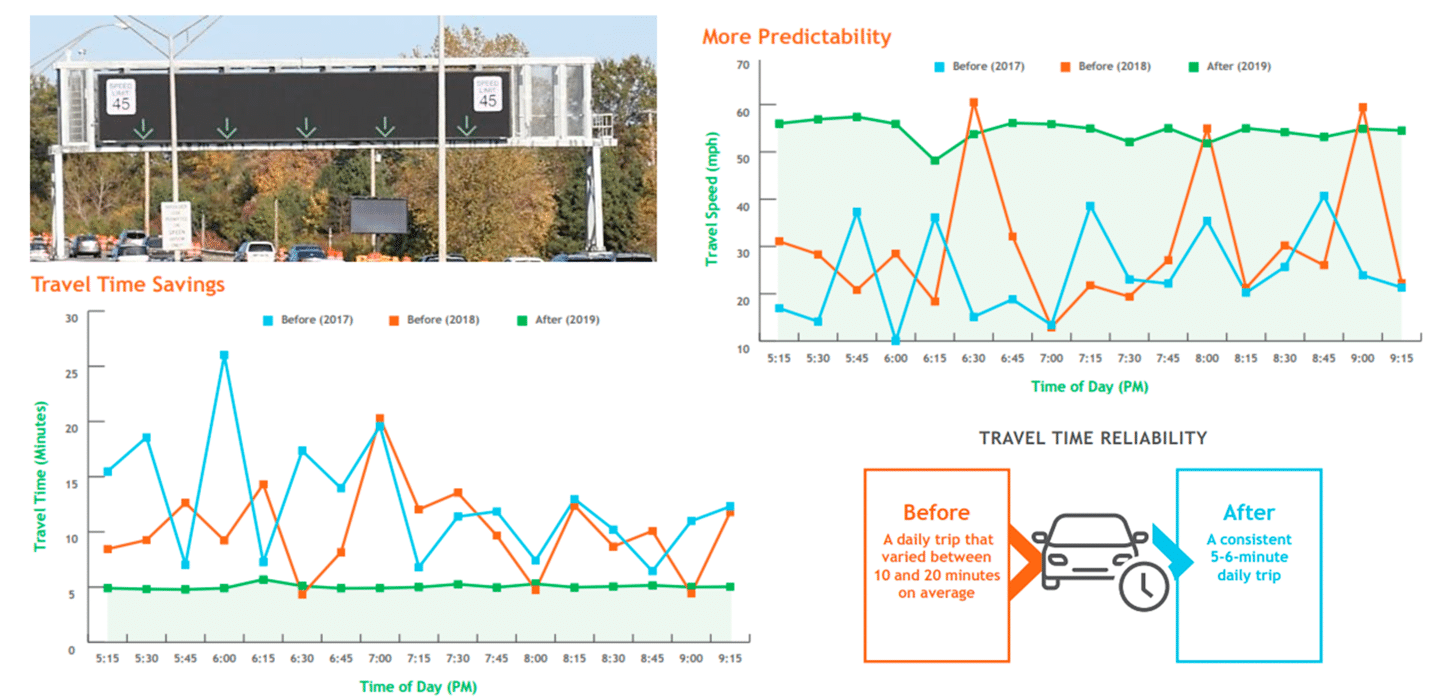
The results were remarkable:
- Average travel time reduced from 20 minutes to just 5 minutes
- Travel time reliability dramatically improved, with consistent 5-6 minute commutes replacing the previous unpredictable 10-20 minute commutes
- Average speeds became more consistent, hovering around 55-60 mph
- Bottleneck conditions practically eliminated during typical operating hours
These improvements didn’t require years of construction and hundreds of millions of dollars. Instead, by using existing right-of-way more intelligently—guided by data every step of the way—ODOT delivered a cost-effective solution that dramatically improved the commute for thousands of daily travelers. With this successful project, ODOT has explored more ATDM solutions across the state.
Lessons for Transportation Agencies
ODOT’s approach to the I-670 SmartLane project offers several valuable lessons for transportation agencies considering similar projects:
- Use data to identify problems
- Use data to refine operations
- Use data to monitor real-time impacts
- Measure and communicate results, yet again using data
Data, when leveraged appropriately, can fuel significant transportation improvements and tell impactful stories of each successful project. Want to learn how INRIX data can support your agency’s next innovative solution? Contact us at sales@inrix.com or visit inrix.com/products/traffic to learn more.