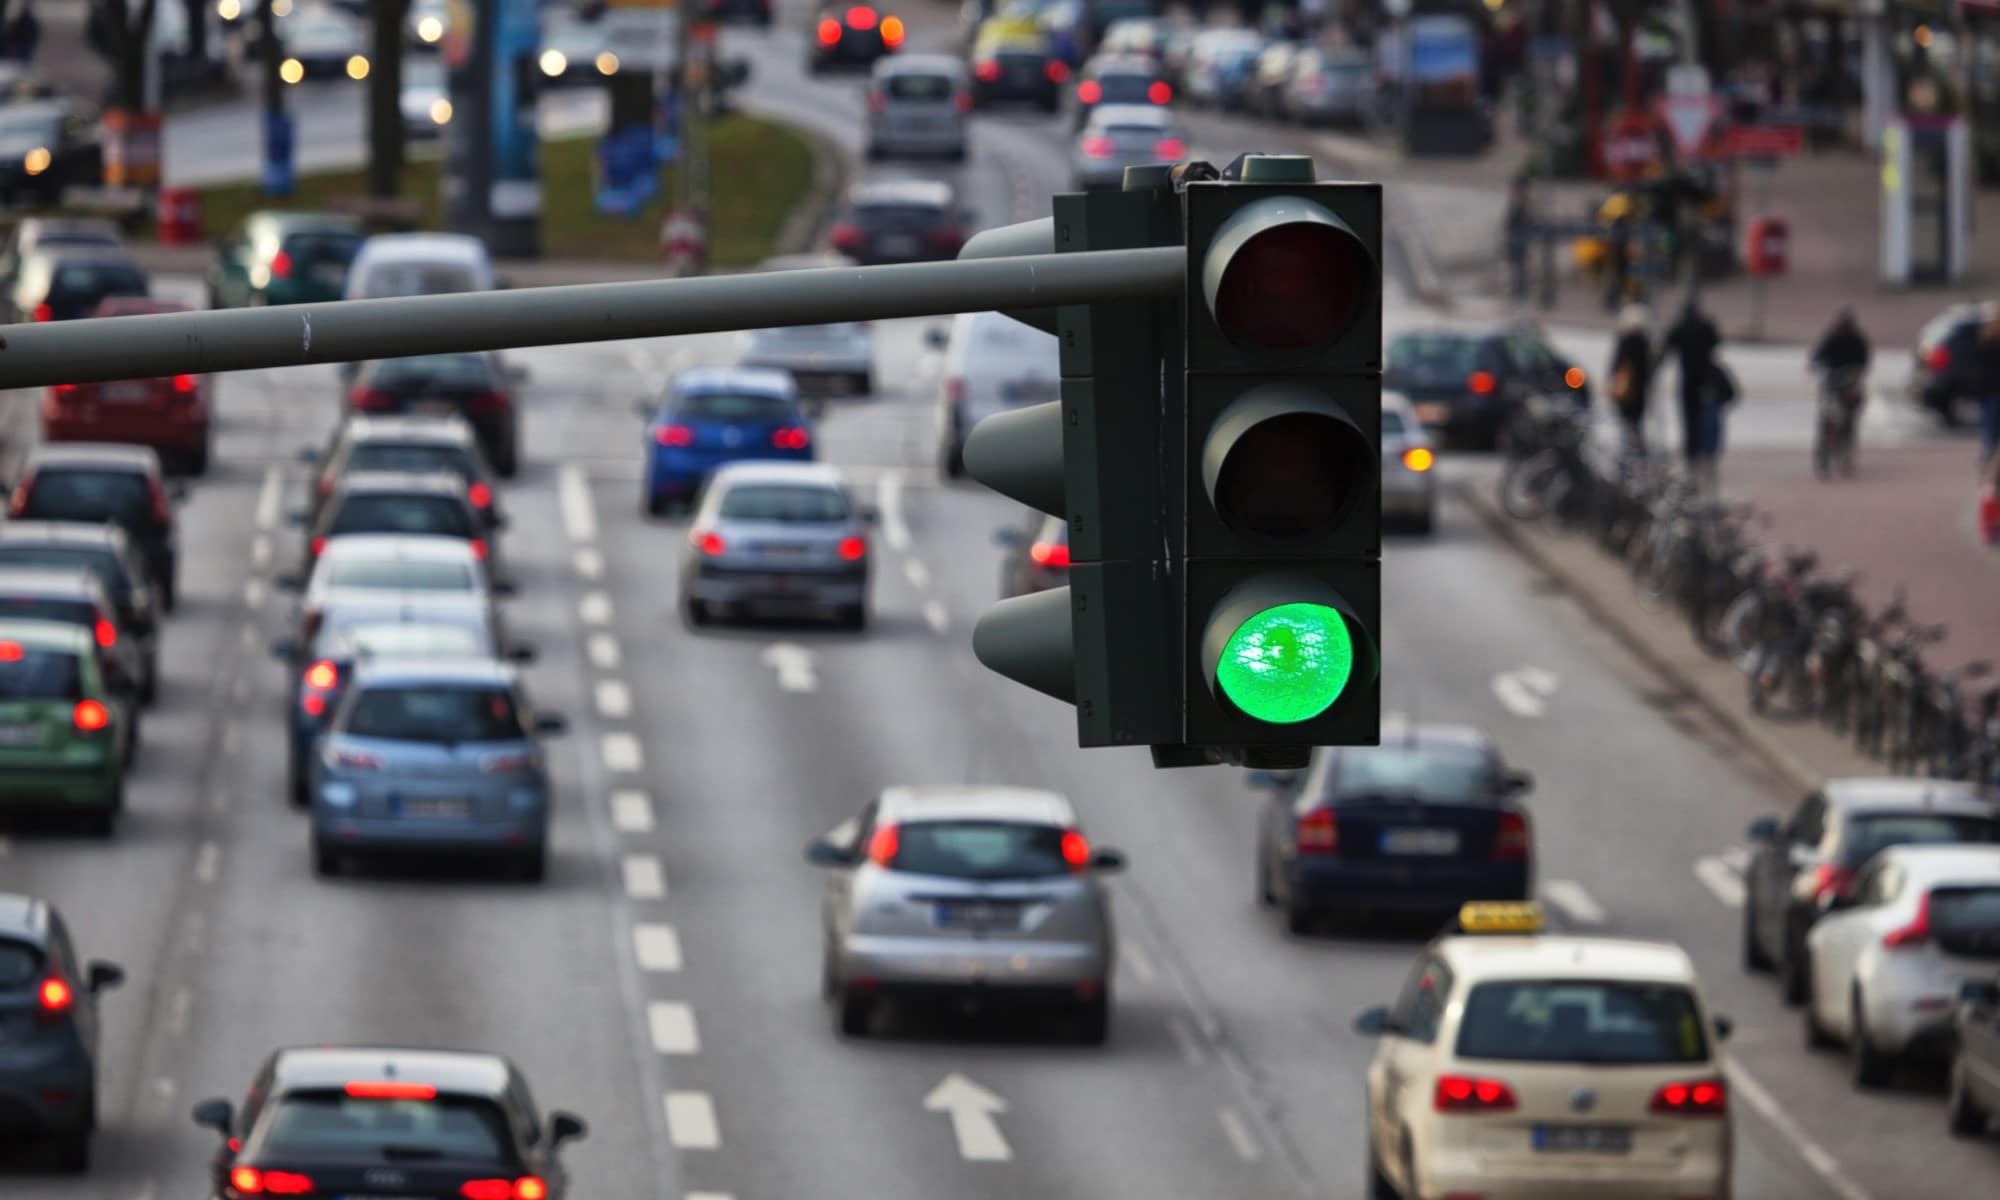
INRIX recently released its 2024 Global Traffic Scorecard, the annual commuting benchmark covering more than 900 urban areas across the globe. Istanbul, Turkey topped the list of the most-congested urban areas as traffic delays surged 15% from 2023 to 105 hours lost per driver, besting both New York and Chicago at 102 hours lost.
Key findings from the report follow. For more information please contact Bob Pishue, Transportation Analyst, at bob.pishue@inrix.com
2024 Global Traffic Scorecard Key Findings:
- The typical U.S. driver lost 43 hours to traffic congestion, equivalent to a full work week, which resulted in $771 worth of time lost. In the U.K., drivers lost an average of 62 hours commuting to work, or about £581 in lost time, whereas in average German driver lost 43 hours in traffic jams, equal to 470 € per driver.
- Congestion cost the U.S. more than $74 billion in 2024, a 1.7% increase from Comparatively, U.K. drivers lost nearly £7.8 billion, up by 11%, while German drivers saw 3.6 billion € in time lost, up 14% from the prior year.
- Telecommuting dropped 8% in the U.S. while remote & hybrid work stayed relatively stagnant in the U.K. Of the large urban metro areas, tech-heavy San Jose, San Francisco, and Seattle saw the largest drops in telecommuting. The number of people telecommuting in San Jose Metro Area dropped 33% between 2022 and 2023, citing the latest data available.
- Trips to downtown grew along with the return to office, however weekends and weekend evenings especially, saw the most growth. This suggests people returning to downtown for purposes other than work (nightlife, arts, dining, retail, etc.).
Summary:
Traffic congestion grew globally in 2024. 520 of the 945 urban areas studied saw increases in traffic versus 2023 (268 went negative, 157 saw no change), however, that growth has slowed in many places. For example, between 2022-2023, 74 of the top 100 urban areas saw double-digit traffic delay growth. However, between 2023-24, just 23 urban areas in the top 100 had double-digit growth. The 2024 Global Traffic Scorecard Rankings follow.
2024 Most-Congested Urban Areas Ranking
| 2024 Impact Rank (2023 Rank) | Urban Area | Country | 2024 Delay per Driver (hours) | 2023 Delay per Driver (hours) |
| 1 (6) | Istanbul | TUR | 105 | 91 |
| 2 (1) | New York City NY | USA | 102 | 101 |
| 3 (5) | Chicago IL | USA | 102 | 96 |
| 4 (2) | Mexico City | MEX | 97 | 96 |
| 5 (3) | London | GBR | 101 | 99 |
| 6 (4) | Paris | FRA | 97 | 97 |
| 7 (10) | Jakarta | IDN | 89 | 65 |
| 8 (7) | Los Angeles CA | USA | 88 | 89 |
| 9 (9) | Cape Town | ZAF | 94 | 83 |
| 10 (12) | Brisbane | AUS | 84 | 74 |
| 11 (14) | Bangkok | THA | 74 | 63 |
| 12 (8) | Boston MA | USA | 79 | 88 |
| 13 (13) | Philadelphia PA | USA | 77 | 69 |
| 14 (11) | Miami FL | USA | 74 | 70 |
| 15 (16) | Dublin | IRL | 81 | 72 |
| 16 (15) | Rome | ITA | 71 | 69 |
| 17 (19) | Houston TX | USA | 66 | 62 |
| 18 (20) | Brussels | BEL | 74 | 68 |
| 19 (21) | Atlanta GA | USA | 65 | 61 |
| 20 (28) | Warsaw | POL | 70 | 61 |
| 21 (22) | Melbourne | AUS | 65 | 62 |
| 22 (18) | Washington DC | USA | 62 | 63 |
| 23 (27) | Seattle WA | USA | 63 | 58 |
| 24 (25) | Milan | ITA | 64 | 60 |
| 25 (17) | Toronto ON | CAN | 61 | 63 |
In the U.S., the latest telecommuting data reveals a massive shift in working from home to commuting to the office, led by tech-heavy metro areas like San Jose, San Francisco, and Seattle. The return to office has boosted use across all modes nationwide (sans work from home), yet the number of transit commuters continued to sit below pre-COVID level, down 26% from pre-COVID times.
U.K. and German commuters traveled heavily into downtown in 2024 versus the year prior, while the U.S. showed moderate growth overall, with some variation from area to area. However, drivers in the U.S. seemed to heavily favor Fridays as the “Fourth Day” in office, as trips grew more that day than any other weekday.
Nighttime trips into downtowns in the U.S. surged more than 12% over 2023, suggesting a moderate return to city centers for nightlife, the arts, and other non-work activities.
Change in evening trips to downtowns in the U.S. (8PM – 12AM)

What to expect in 2025
Government officials, transportation professionals and the general public should prepare for more time wasted sitting in traffic in 2025, especially as remote work continues to decrease across the country. Telecommuting will still be the #2 commute mode behind driving, by far, but data so far points to an increase in driving as well as significant increases in transit ridership resulting from a five-day work week.
Additionally, New York City implemented the first-in-the-nation cordon pricing program on January 5, 2025 to reduce congestion in the city core. Other cities may look to combat congestion through pricing as well, as some form of vehicle-miles traveled fee or toll system has already been explored (and even included) in long-range transportation plans by local governments.


