


GUEST POST: Ted Trepanier, Senior Director – Public Sector Services, INRIX
I am really excited today as we launch new daily reports and dashboard enhancements to the INRIX Signal Analytics platform. Last year, in cooperation with our CATT Lab partners, we launched the first probe-vehicle based signal analytics platform, making ATSPM type metrics available for all signalized intersections without the cost of installing or maintaining detectors. It is a powerful tool that provides quality metrics for each individual movement at every intersection, allowing agencies to see, prioritize, and evaluate all movements. While providing great utility, as with most v1 platforms, it couldn’t meet every need being asked on Day 1. While powerful, the tool is based on processing individual queries and reviewing results at the individual movement level. The number one agency request I hear repeatedly is to add the ability to scan an entire system and identify what intersections needed attention. I am happy to say: that day is here.
Looking Back on How Traffic Signal Management Has Evolved:
A little personal history, it was 1986 when I promoted into the WSDOT Eastern Region Traffic Office. While it seems like not that long ago, for reference, the 80386 Intel Based PC was state of the art, Spec 170 traffic signal controllers were just being broadly deployed, and we were still drafting time-space diagrams by hand. I was excited to learn all about the relationships of splits, offsets, gap-time, cycle lengths, and dilemma zones. It was fun to crunch the numbers to compile updated plans, deploy them in the field and see the results firsthand. While fun, it wasn’t a fast process. It started with a memo mailed (yes, snail mail) to the state data office with diagrams of intersections to be retimed the upcoming season. A few weeks, sometimes months later, we would get back the intersection diagrams with tidy numbers noted by each movement. Then, my analysis could begin. With a spare 170 controller and shiny new EPROM burner on the corner of my desk, the next two years I learned a lot. We had great training and experience in the region to draw from and in a short time I was starting to push the envelope myself. I was the first in the area to bring a laptop PC into the field and download new timing plans into an active controller. Until then, updated timing parameters meant pushing a lot of buttons, or even flipping dip switches on the controller faces. It was a new era and great fun.
Performance Measures Helped Quantify Benefits and Maximize Efficiencies:
Fast forward a few years, I had worked my way up in the region to be the Regional Traffic Engineer and, in a moment of weakness, accepted a request to become the State Traffic Engineer for WSDOT. Transplanted to HQ and working across the street from our legislature, I was back on the steep side of the learning curve. Now my job not only included managing the statewide program for traffic signal operations but “going across the street” and presenting the related budget request to the state legislature. It was 2005 and WSDOT was leading the way in implementing new tools for transportation agencies in how to present their story to elected officials – Performance Measures. Rolled out in the now well-known Gray Notebook, the agency adopted performance metrics for each activity of every program that could be quantified. Among our other functions, my team was charged with quantifying benefits of the traffic signal retiming program. We had no data to start. Ideally, PMs are based on outcomes. But often outcomes can be hard to quantify so we drop back one level and measure the activity intended to produce the favored outcome. Such was the case with traffic signals, the desired outcome of the retiming program is to maximize system efficiency. Essentially, reduce overall vehicle delay and associated GHGs while facilitating safe movement of pedestrians and bicycles. Not having any capability to measure vehicle delay on a system basis, we adopted an industry best practice for scheduled retiming (the activity) and started collecting the data. We set a goal of retiming all signals on a 3-year cycle, with annual checks to the urban high-volume locations. And, as is often the case, the numbers for each quarterly report improved, more and more signals being retimed on schedule. The department secretary at the time had a mantra he was well known for: “what get measured, gets managed, gets done.” It was true then, still true now.
Making the Jump from Public to Private Sector:
It was 2010 when I made the jump to INRIX. As I have written before, one of the real draws to INRIX was the chance to be involved with visioning new products and services specific to needs of public agencies. The work at WSDOT HQ was interesting and rewarding but the energy of working at a tech start-up was electric – I was back in the fun zone. Within two years I had worked with a small team and the CATT Lab and the University of Maryland to launch the first nationwide roadway performance analytics platform. Revolutionary at the time, it still provides great value today with congestion measure for all major roads (now in 40+ countries). But as powerful and comprehensive as it was, the metrics were primarily focused on freeway operation. Performance of arterials is governed by performance of the traffic signals; more was needed. Enter Signal Analytics.
As I noted at the start of this post, the signal analytics platform we launched at TRB last year was revolutionary in providing measurement for each individual movement for every signal in an agency system without installing any field equipment. Completely powered by connected car data, like the roadway analytics platform, it covers the entire system. Today the platform takes a huge leap forward with the addition of the Daily Reports and Dashboards. The number one agency request I would hear repeatedly as we got feedback from signal operators was for a platform that could scan an entire system and identify what intersections needed attention. I was at the state ITS conference a year past when the director of the city traffic department said what he really needed was a report sitting on his desk every morning that would tell him what signals needed attention. I was thinking to myself – hang in there, we are working as fast as we can. Now, that vision is reality. Agencies can now prioritize and measure their signal improvements based on outcomes rather than activity. Attacking the signals that are causing the most undue delay, not those whose number has come up in the rotation.
Virtual Infrastructure and Powerful Analytics Are Making Analysis Faster, Cheaper, More Scalable—- and EASIER:
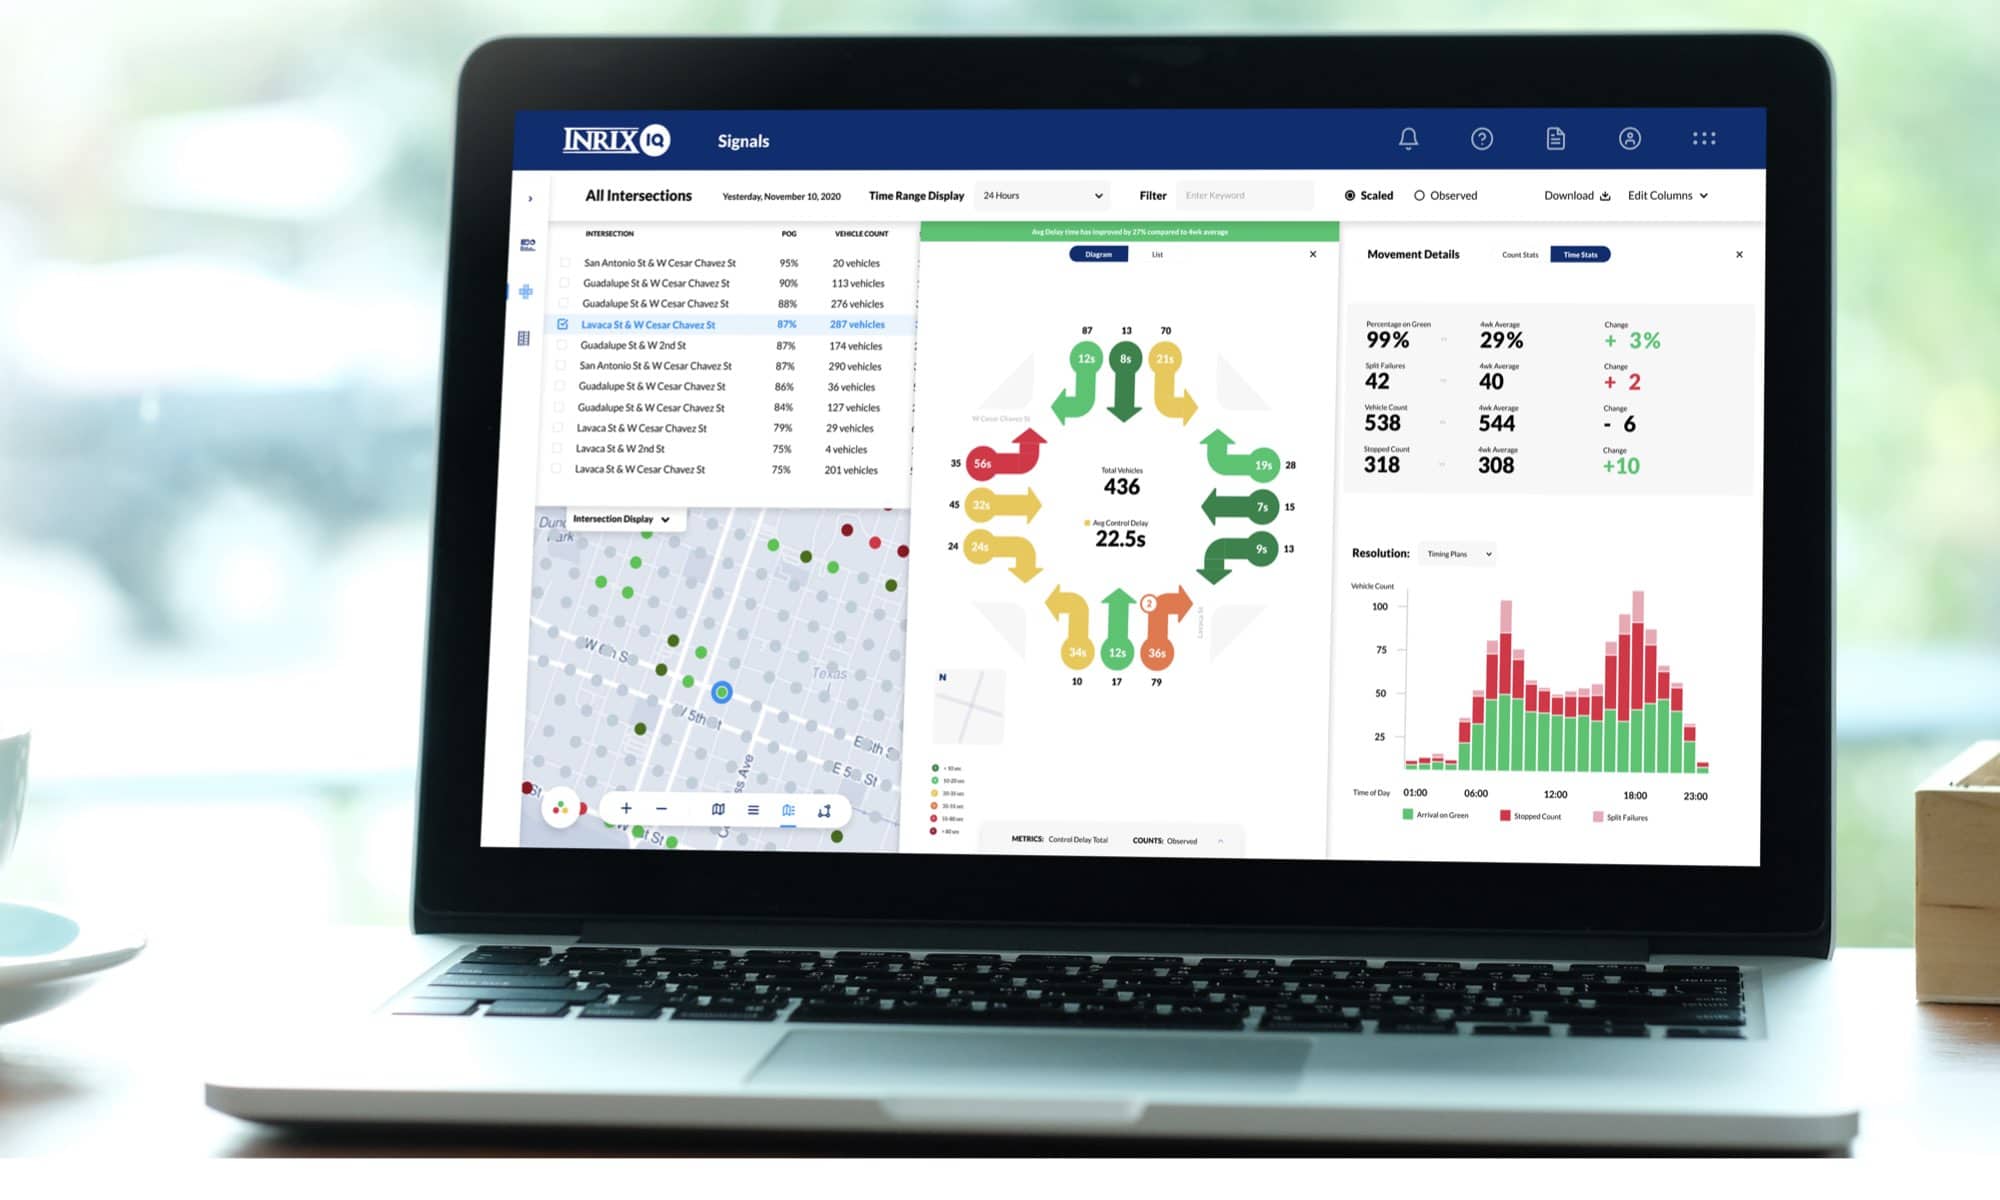
For most departments today, this shift is even more critical as many budgets have been squeezed to the point that visiting all signals on any reasonable rotation is no longer possible. With the new reports and dashboards, agencies will be able to see a stack-ranked list of all signalized intersections indicating where the greatest delay is occurring as well as a list of what locations have changed the most, indicating the possibility of a malfunction or unexpected shift in the traffic patterns. With these new tools added to the complete signal analytics suite, agencies now have complete information to prioritize projects, see emerging problems, tune systems, and quantify the benefits of their efforts.
From my days working in the field retiming systems, through regional traffic management, up to my position as director of traffic operations – I would have loved to have this tool. Now, it would be great fun showing it to you.
If you would like a demo, visit the signal analytics page or shoot me an email.
ted@inrix.com