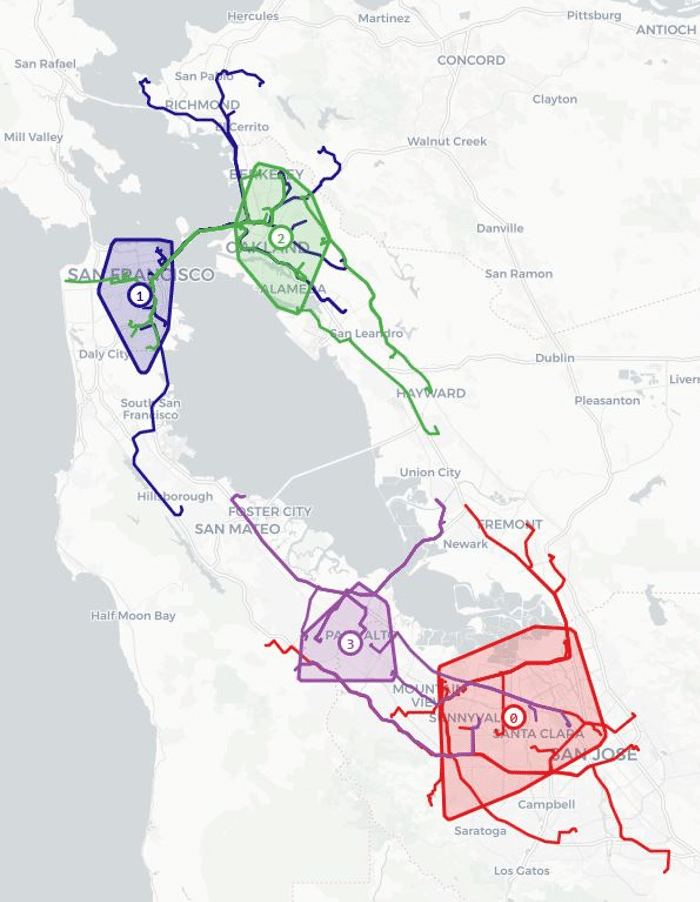


The 2019 Global Traffic Scorecard constitutes the most detailed account of commuter behavior to date. In prior reports, the primary routes focused into and out of downtown cores. i.e. The traditional suburb to urban commute pattern. However, while the downtown core has the highest number of jobs, particularly in larger cities, there are multiple high job density areas within a metro area. By using observed trip data, the 2019 INRIX Scorecard both identified neighborhoods based upon the prevalence of commutes, and calculated time delay experienced by commuters to each of these neighborhoods. The reduction in time lost for many cities compared to last year is a reflection of the diversity of commutes now being captured, not just those that occur in the central business district. The San Francisco Bay area epitomizes the commute diversity that occurs within a region. Four major commute areas emerge: San Jose, San Francisco, Menlo Park, and Oakland. Each of which has a distinct commuter experience.
| Code | Area | Peak Speed (MPH) | Last Mile Peak (MPH) | Free Flow (MPH) | Last Mile Free Flow (MPH) | Time Loss |
| 0 | San Jose | 28 | 20 | 55 | 24 | 89 |
| 1 | San Francisco | 25 | 11 | 43 | 15 | 91 |
| 2 | Oakland | 31 | 15 | 47 | 19 | 61 |
| 3 | Menlo Park | 28 | 17 | 45 | 21 | 78 |
Commuters to Menlo Park will lose 78 hours per year on average in contrast to those going to San Francisco who will lose 91 hours per year on average. Furthermore, the experience of drivers varies significantly in terms of speed in addition to time loss. The high density neighborhoods of San Francisco and lower levels of access to Interstates and State Highway result in last mile speeds of only 15 MPH whereas commuters in San Jose experience last mile speeds of 24 MPH or 60 percent faster. Despite the massive differences in speed, drivers to San Jose lose 89 hours per year, only 2 hours less.
Commute diversity within a metro is a pattern that holds throughout cities analyzed, both within the United States and globally. When analyzing congestion within a metro, it is critical to do so within the context of specific areas. The 2019 Global Traffic Scorecard for the first time enables sub area commute analysis on a global scale.