Product
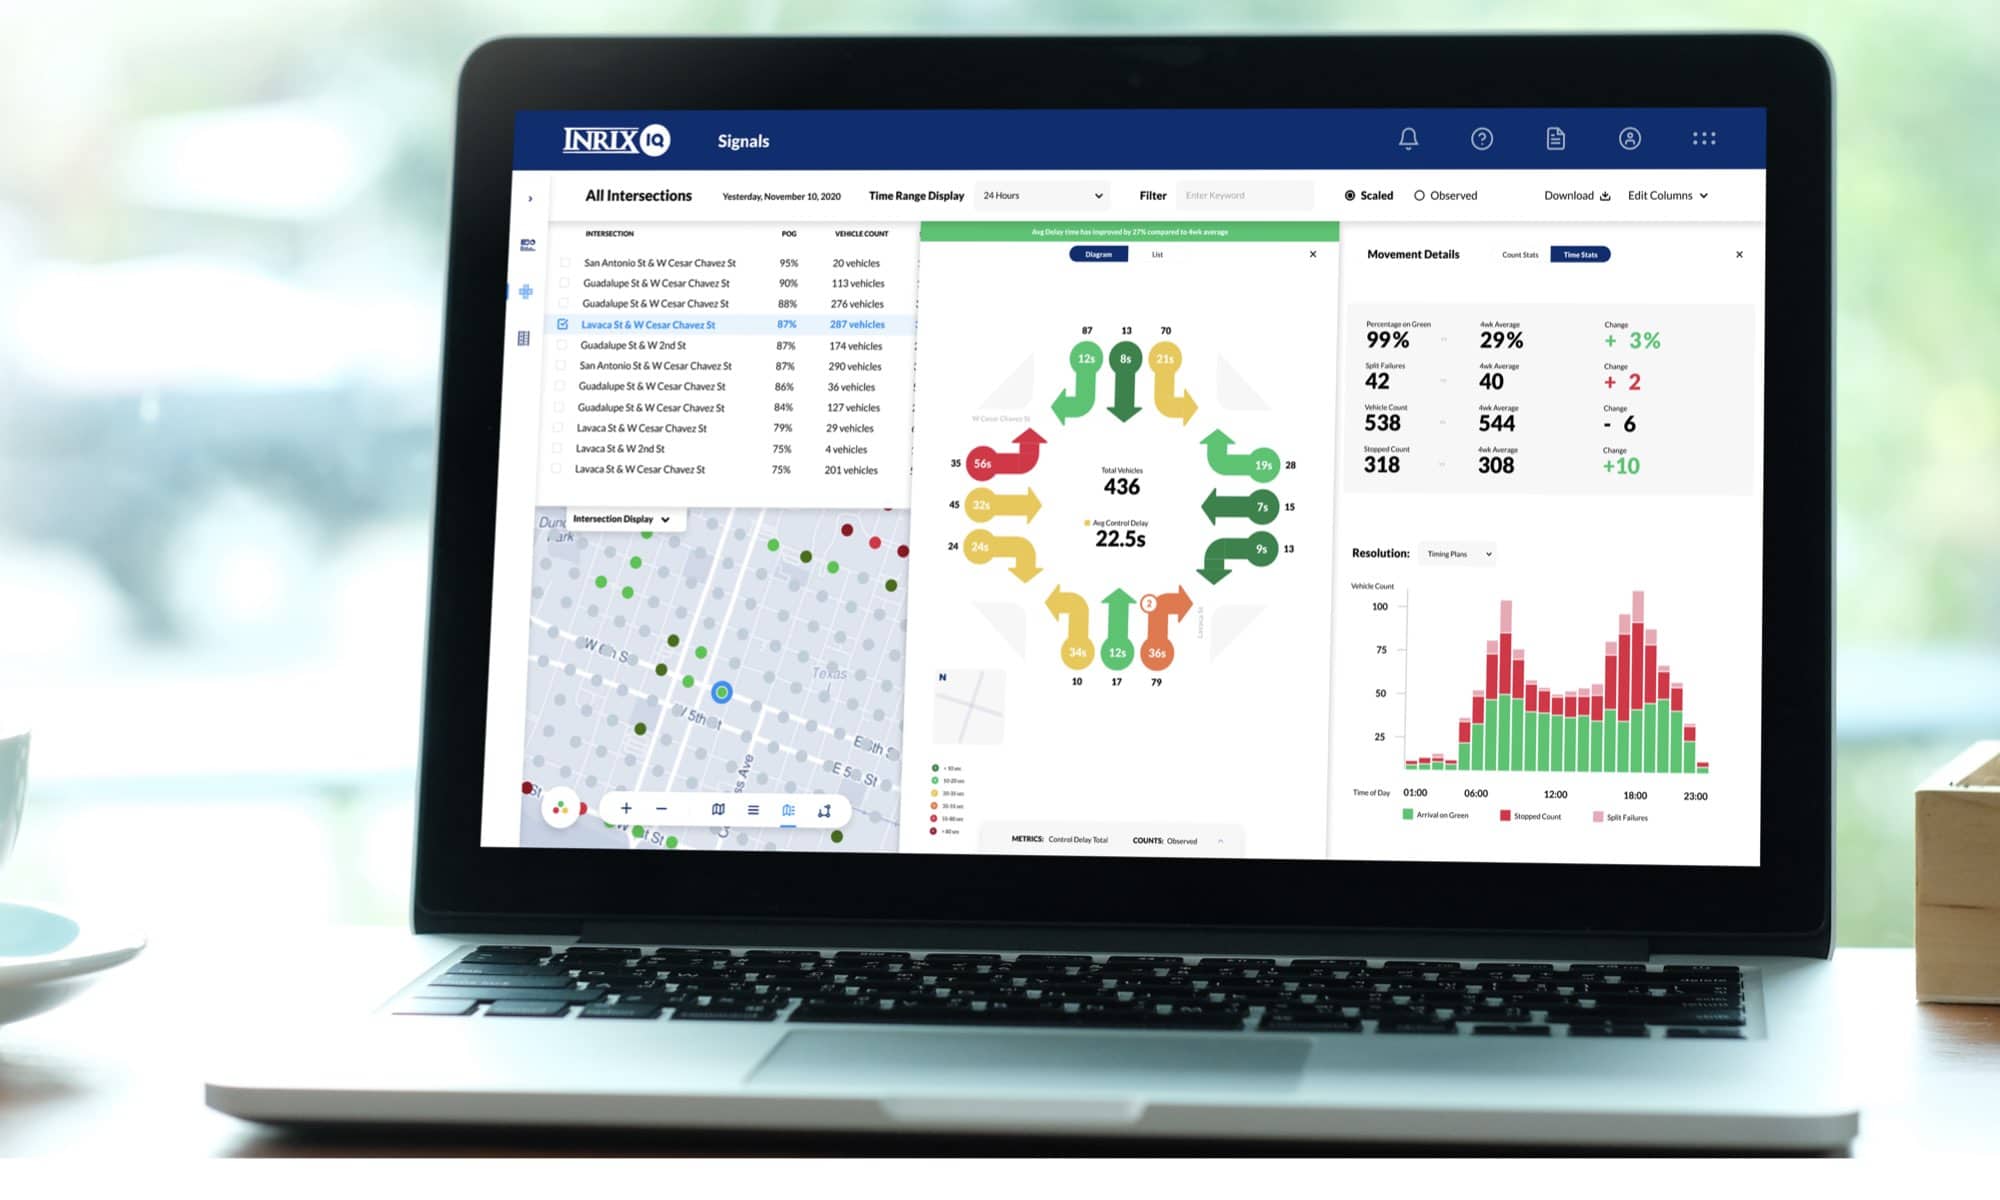
INRIX Signal Analytics
Powerful data and tools to visualize traffic signal performance trends and daily reports to proactively help you identify and solve problems faster than ever before.
Learn More
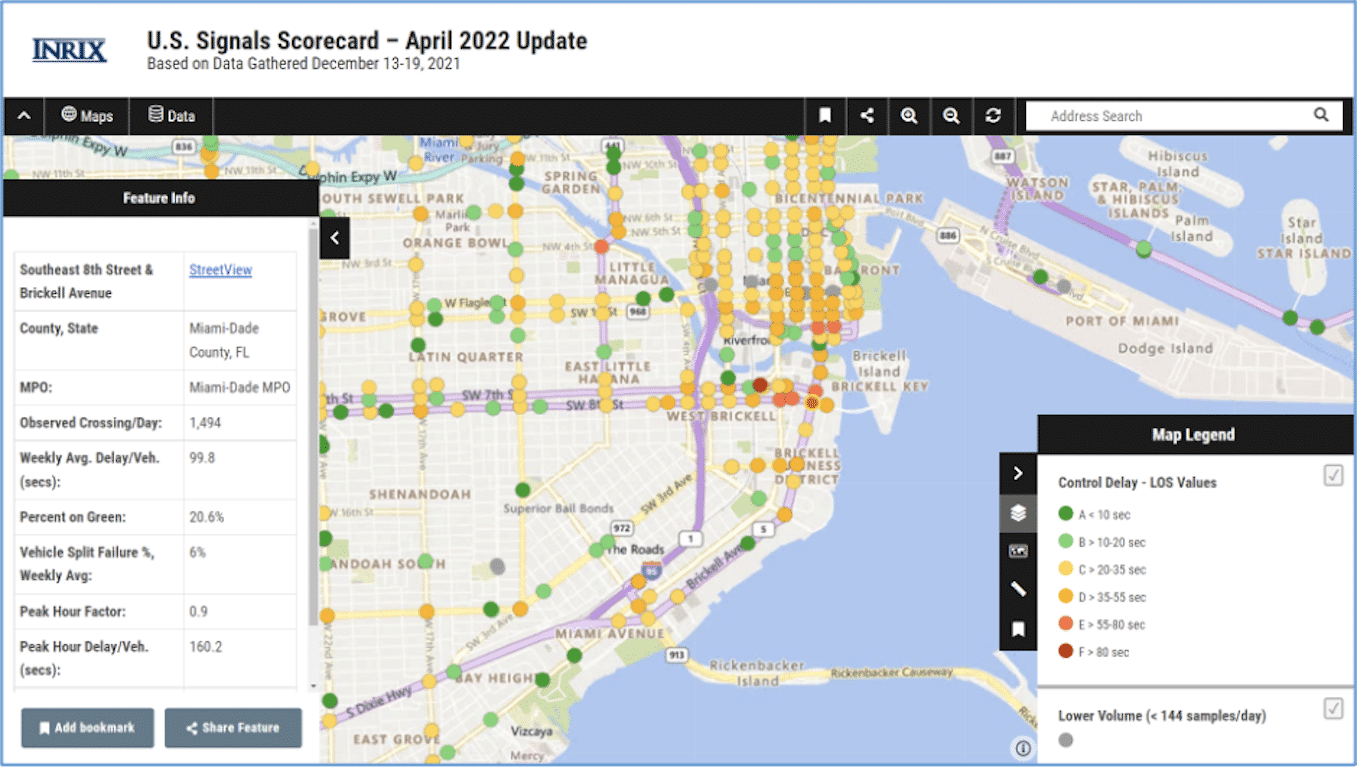
The 1st National Benchmark of Key Traffic Signal Performance Measures Using Connected Vehicle Data.
Use the interactive map below to dig into the data from our report to see traffic signal performance grades by state, region, county, city and even the block level.
Powerful data and tools to visualize traffic signal performance trends and daily reports to proactively help you identify and solve problems faster than ever before.
Learn MoreThis post digs into some of the key details and surprising findings of the INRIX U.S. Signals Scorecard.
Learn MoreThe INRIX U.S. Signals Scorecard provides national benchmarking of key traffic signal performance measures. Join us as we unpack the latest findings from the April 2022 update.
Learn More