


Today we have released an update of the U.S. Traffic Signals Scorecard. Leveraging one week of data from December 13-19, 2021, the scorecard provides a national benchmark of key traffic signal performance measures. In February 2021, INRIX published the original scorecard, providing the first systemic nationwide analysis and summary of all movements at more than 210,000 signalized intersections across the country. The updated scorecard includes comparisons to the week of data from the week of October 4-10, 2020, used in the original scorecard. Unsurprisingly, given the progress in pandemic recovery in the 14 months between datasets, volume and resulting signal delay have increased.
INRIX Signal Analytics, a service provided in partnership with the University of Maryland’s CATT Laboratory, generated the data analyzed in the Scorecard. The Scorecard describes the methodology used to generate results and findings. At a high-level, a critical mass of connected vehicles providing accurate location updates every 5 seconds or less were analyzed as they move through the road network. Interactions with known/mapped signalized intersections (we call ‘observed crossings’) are logged, and performance metrics are calculated and aggregated in 15 minute increments.
National Results and Findings
Over 240,000 intersections are analyzed, up 30,000+ from the original scorecard, based on nearly 1.2 BILLION total observed crossings over the week. Results and trends at multiple levels of geographic aggregation are provided – national, state, metropolitan area and county levels. The figure below summarizes the updated national daily average statistics, with the results from the original scorecard in parentheses.
Highlights include:
- More Signals Analyzed: +14% (241,181 up from 210,815)
- More Observed Crossings: +13% (nearly 1.2 billion, up from just over 900 million for the week)
- More estimated daily volume per signal: +11% (roughly 19,300, up from 17,400)
- More Delay/Vehicle: +8% (18.3 seconds on average, up from 16.9)
- More Delay/Signal: +20% (98 hours per day, up from 82)
- More Total Delay: +37% (23.7 million hours per day, up from 17.25 million)
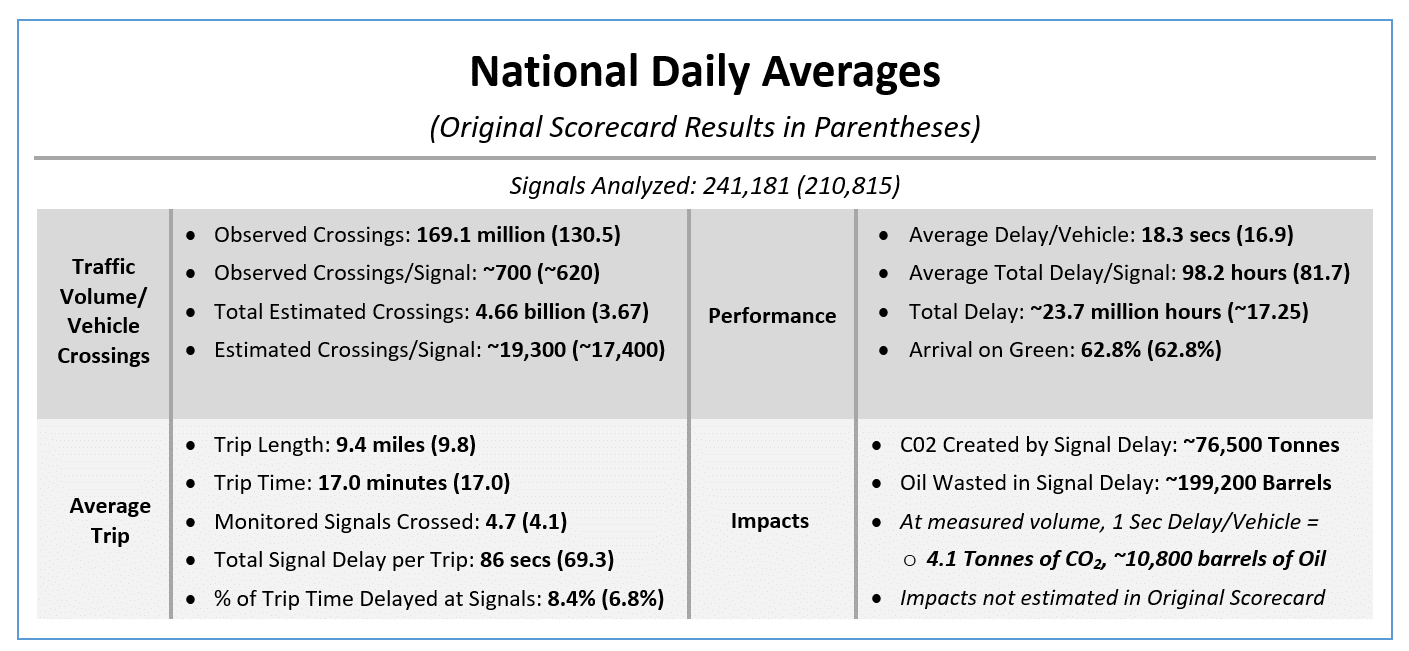
The scorecard update also introduces and estimates the impacts of idling due to signal delay in terms of greenhouse gas creation (GHG) creation and fuel use. If the week analyzed is extrapolated for a full year, overall nationwide signal delay creates nearly 28 million metric tons of CO2 and burns over 70 million barrels of oil. While all or most signal delay can’t be eliminated, better or worse marginal performance has a direct impact on the creation of GHG and fuel consumption. At the traffic volume analyzed, a one second improvement or degradation in delay per vehicle generates or eliminates 1.5 million metric tons of CO2 and burns or saves 3.9 million barrels of oil annually.
The scorecard identifies five key findings, re-examining two findings from the original scorecard and adding three more. Detailed discussion for each is included in the scorecard. Note while the results provided in the scorecard are facts, these findings are editorial in nature. We welcome debate on any/all findings:
- Signals contribute more to overall network delay than previously thought (original finding, reaffirmed in this update)
- Middays need more attention (original finding included ‘AM peak may need less’ – revised finding to continue to underscore midday relevance while data showing AM peak is returning at least to some extent, albeit likely at a lower level over a reduced peak period)
- Travel patterns are on the way, but not yet at, the ‘new normal’ (new finding)
- Consider ‘time of year’ timing plans (new finding, where appropriate)
- Signals and Climate – Part of the Solution…or the Problem? (new finding)
In reviewing the results, an additional finding not fully documented within the report seems more noteworthy upon reflection – peak hour definitions. I let the data drive peak period definition and for this week in December 2021, we ended up with 7-9am and 3-6pm as the obvious weekday demand and performance peaks. While debatable how durable these peak periods will be, a short morning peak and an earlier evening peak than anecdotally was typical around the country pre-pandemic may have the making of a ‘new normal,’ and will be something to watch.
Analysis of Intersection Level Details
While the Scorecard aggregates results nationally, by state, by county and by metropolitan area, detailed results for all signalized intersections for the week was used. The scorecard highlights a handful of these using various metrics and timeframes. Of the 91 total intersections listed in the seven tables (and a few are in more than one table), it is notable that 21 different states and 57 different counties have at least one signal in these tables.
The scorecard reflects performance for the 24-hour period, INRIX Signal Analytics provides the ability to examine peak periods and custom date ranges. To expose details for all signals analyzed, we updated the online signals scorecard map, with greatly expanded details for each signal, including peak demand hour and results for that hour. See below for the signal with the highest weekly average delay per vehicle in the US for the week analyzed.
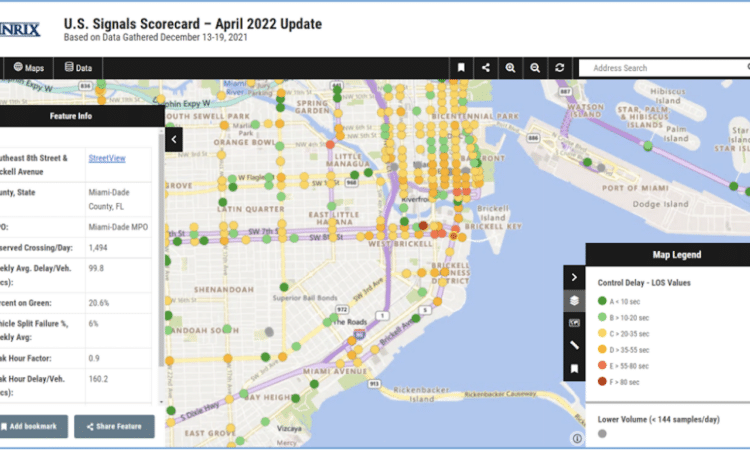
The INRIX U.S. Signals Scorecard provides national benchmarking of key traffic signal performance measures, including the best and worst performing intersections. Did your region make the list? Click here to download the full report.