


Nearly every urban area across the world saw retractions in driving last year. COVID-19 and related shutdowns led to unprecedented drops in travel through land, sea and air. Surface transportation modes: auto, bus and rail transport saw large declines, and in most areas, have yet to recover to pre-COVID levels. Leisure, entertainment, and tourism travel plummeted as cruise ships remained docked, restaurants and concert halls closed, and 40% of airline seats remained empty.
Due to the nature of the COVID-19 pandemic, it became clear that downtown areas were more uniquely affected than suburban or rural areas, given the agglomeration of employment/office buildings, entertainment, night life and restaurants – namely, gathering spaces. We also wanted to analyze transit during this time, as ridership largely revolves, though not entirely, about getting people into and out of downtown, including for essential workers.
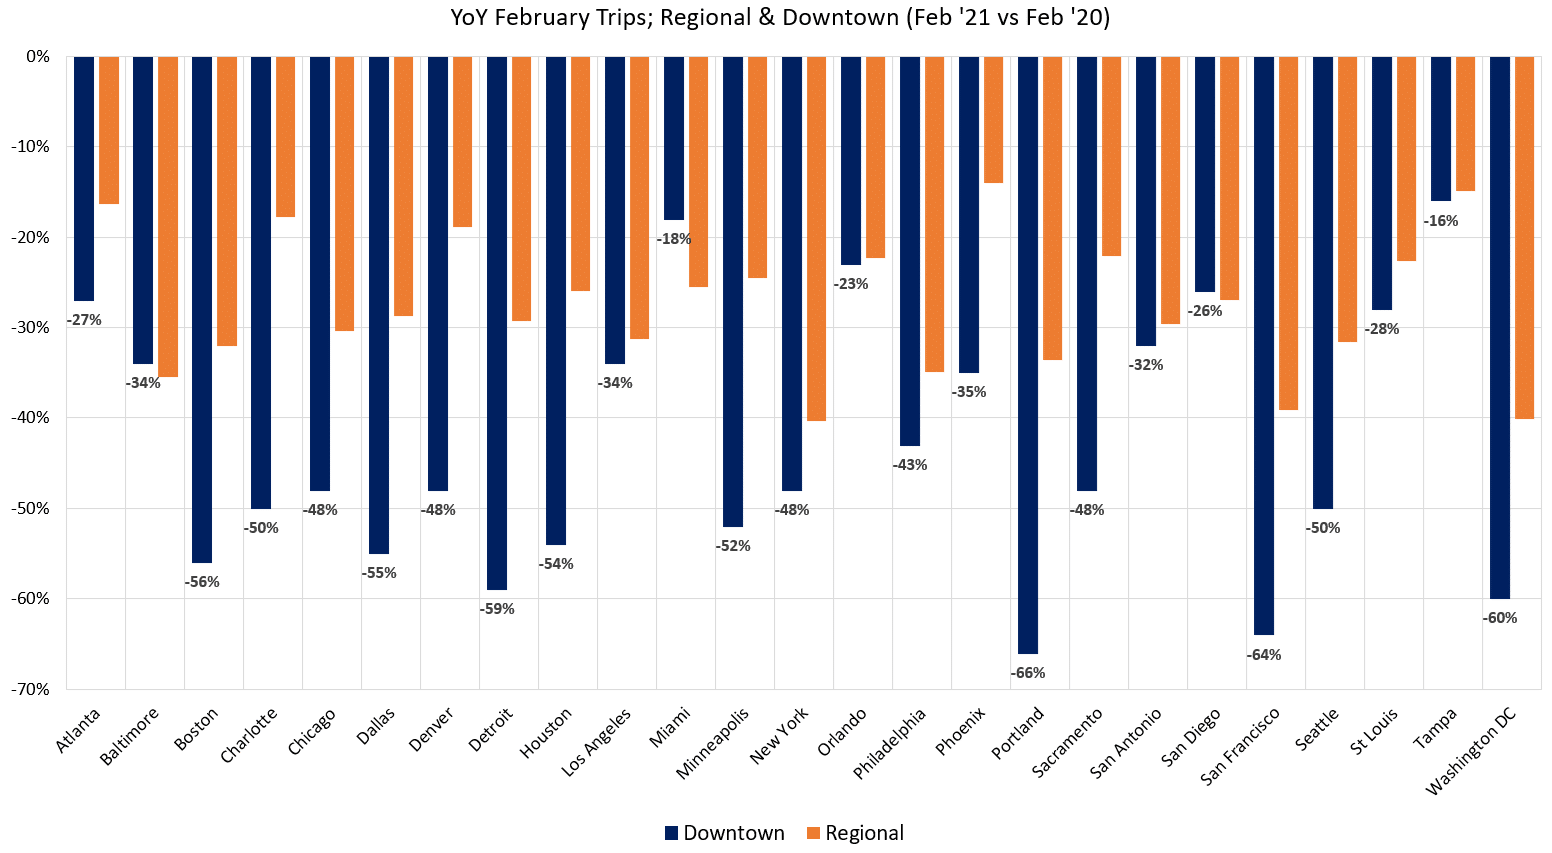
Year over year, significant variation continues to exist in trips to downtown, ranging from -18% change in Tampa, FL to -66% in Portland, OR. In all but 3 areas (Baltimore, Miami and San Diego) trips to downtown still lag regional trips, with the largest differences in Charlotte (-18% regional vs -50% downtown), Portland (-34% regional vs -66% downtown) and Detroit (-29% regional vs -59% downtown). The data clearly show the effects of “work from home” policies and the outsized affects COVID-19 has on downtown central business districts, specifically.
Commuting Zones
| Drilling down further into Seattle drivers’ commutes, INRIX analyzed trips in the Puget Sound Region to measure the impact of office closures and government restrictions to commercial activities downtown.
Using INRIX Trips data, we analyzed the origins of trips to Downtown Seattle, between 7AM – 10AM in February, April and December, bucketed into trip lengths.
Interestingly, we found trips get shorter, with trips under five miles increasing from 20% of trips to 25% of trips in December. Median trip lengths into downtown decreased 20%, from nearly 13 miles to 10.3 miles. Normalized Trips to Downtown Seattle (September)
|

Legend
Despite the decrease in average trip lengths, origin maps reveal some pockets of essential workers still making long commutes. By April, we see significant drops in key commuting neighborhoods. Commuting to downtown Seattle from the Eastside dropped in many zones to just 10% of February levels. Other large commuting zones to Downtown, like Capitol Hill and Queen Anne dropped significantly, but still remained the largest origins heading to the center city. By September, the city of Seattle regained some trip origins throughout the city, between one-third and two-thirds of pre-COVID level. Travel from the Eastside (Bellevue, Redmond, Kirkland, Sammamish and Bothell) remained largely unchanged from April, at less than one- third of pre-COVID levels, while trips increased North and South of Seattle, from Everett, Marysville, Lake Stevens and Granite Falls to Puyallup, Fife to the north and Lakewood further to the south. |
||||||||||||||||||||||||||||||


Transit use during the Pandemic
Transit use during the pandemic has been front-and-center in transportation circles with questions on when transit ridership will recover, most recently about public transit being part of a COVID-19 relief bill. Besides compiling an annual transit ridership comparison for 295 Urban Areas, we have looked at transit ridership as it pertains to trips to downtown – as access to downtown is a primary driver of transit ridership.
The scatter plot shows reductions in transit ridership and in downtown trips across February, April, September and December of 2020 to 2019.
Unsurprisingly, transit ridership correlates with downtown trips. This should indicate that transit ridership should rise alongside demand for downtown trips.
Ultimately, its likely that transit ridership, along with VMT ‘recovery,’ will hinge upon what happens to “downtowns” and job centers. While working from home was already accelerating pre-pandemic, it got an adrenaline boost and appears to be a more permanent commute option for many. This has likely led to massive reductions in transit ridership, which appears to be tied to downtown’s recovery, perhaps moreso than concern over COVID-19.
Schools and Universities are still 100% remote in many areas, and it may be until Fall of 2021 until back in session. This too will have an effect on traffic congestion through the rest of the year.
In short, we expect VMT to continue its gradual return in most major metropolitan areas, just as it has the last eight months, and most gains will likely be focused on downtowns, as suburbs and rural areas are already approaching (or have approached) their pre-COVID level of travel.