


Growth in VMT does not follow vaccinations – so far.
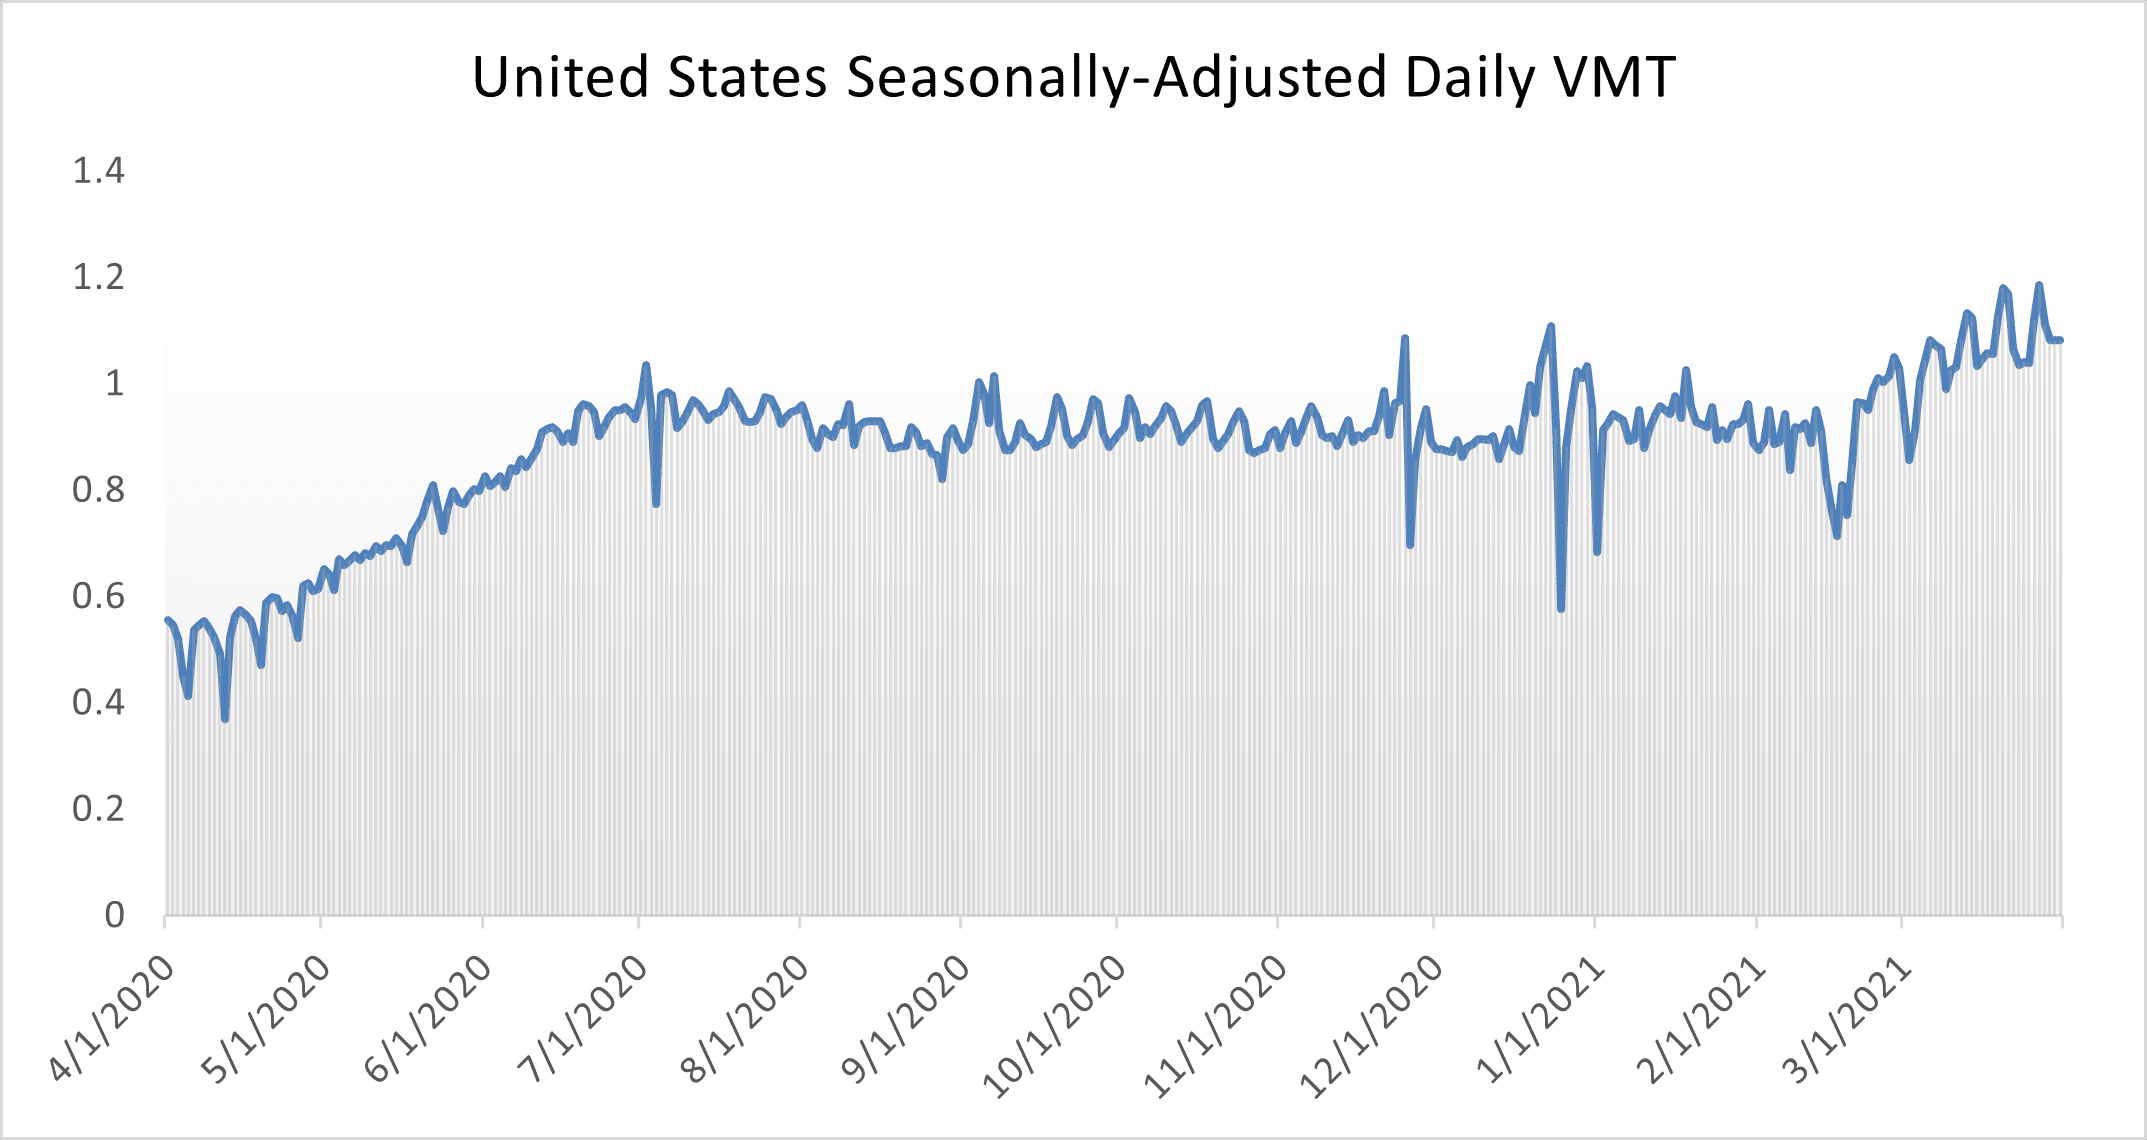
INRIX continues to monitor vehicle miles traveled (VMT), the amount people drive, as the country re-emerges from COVID-19. VMT across the United States has continued to surge since the beginning of March.
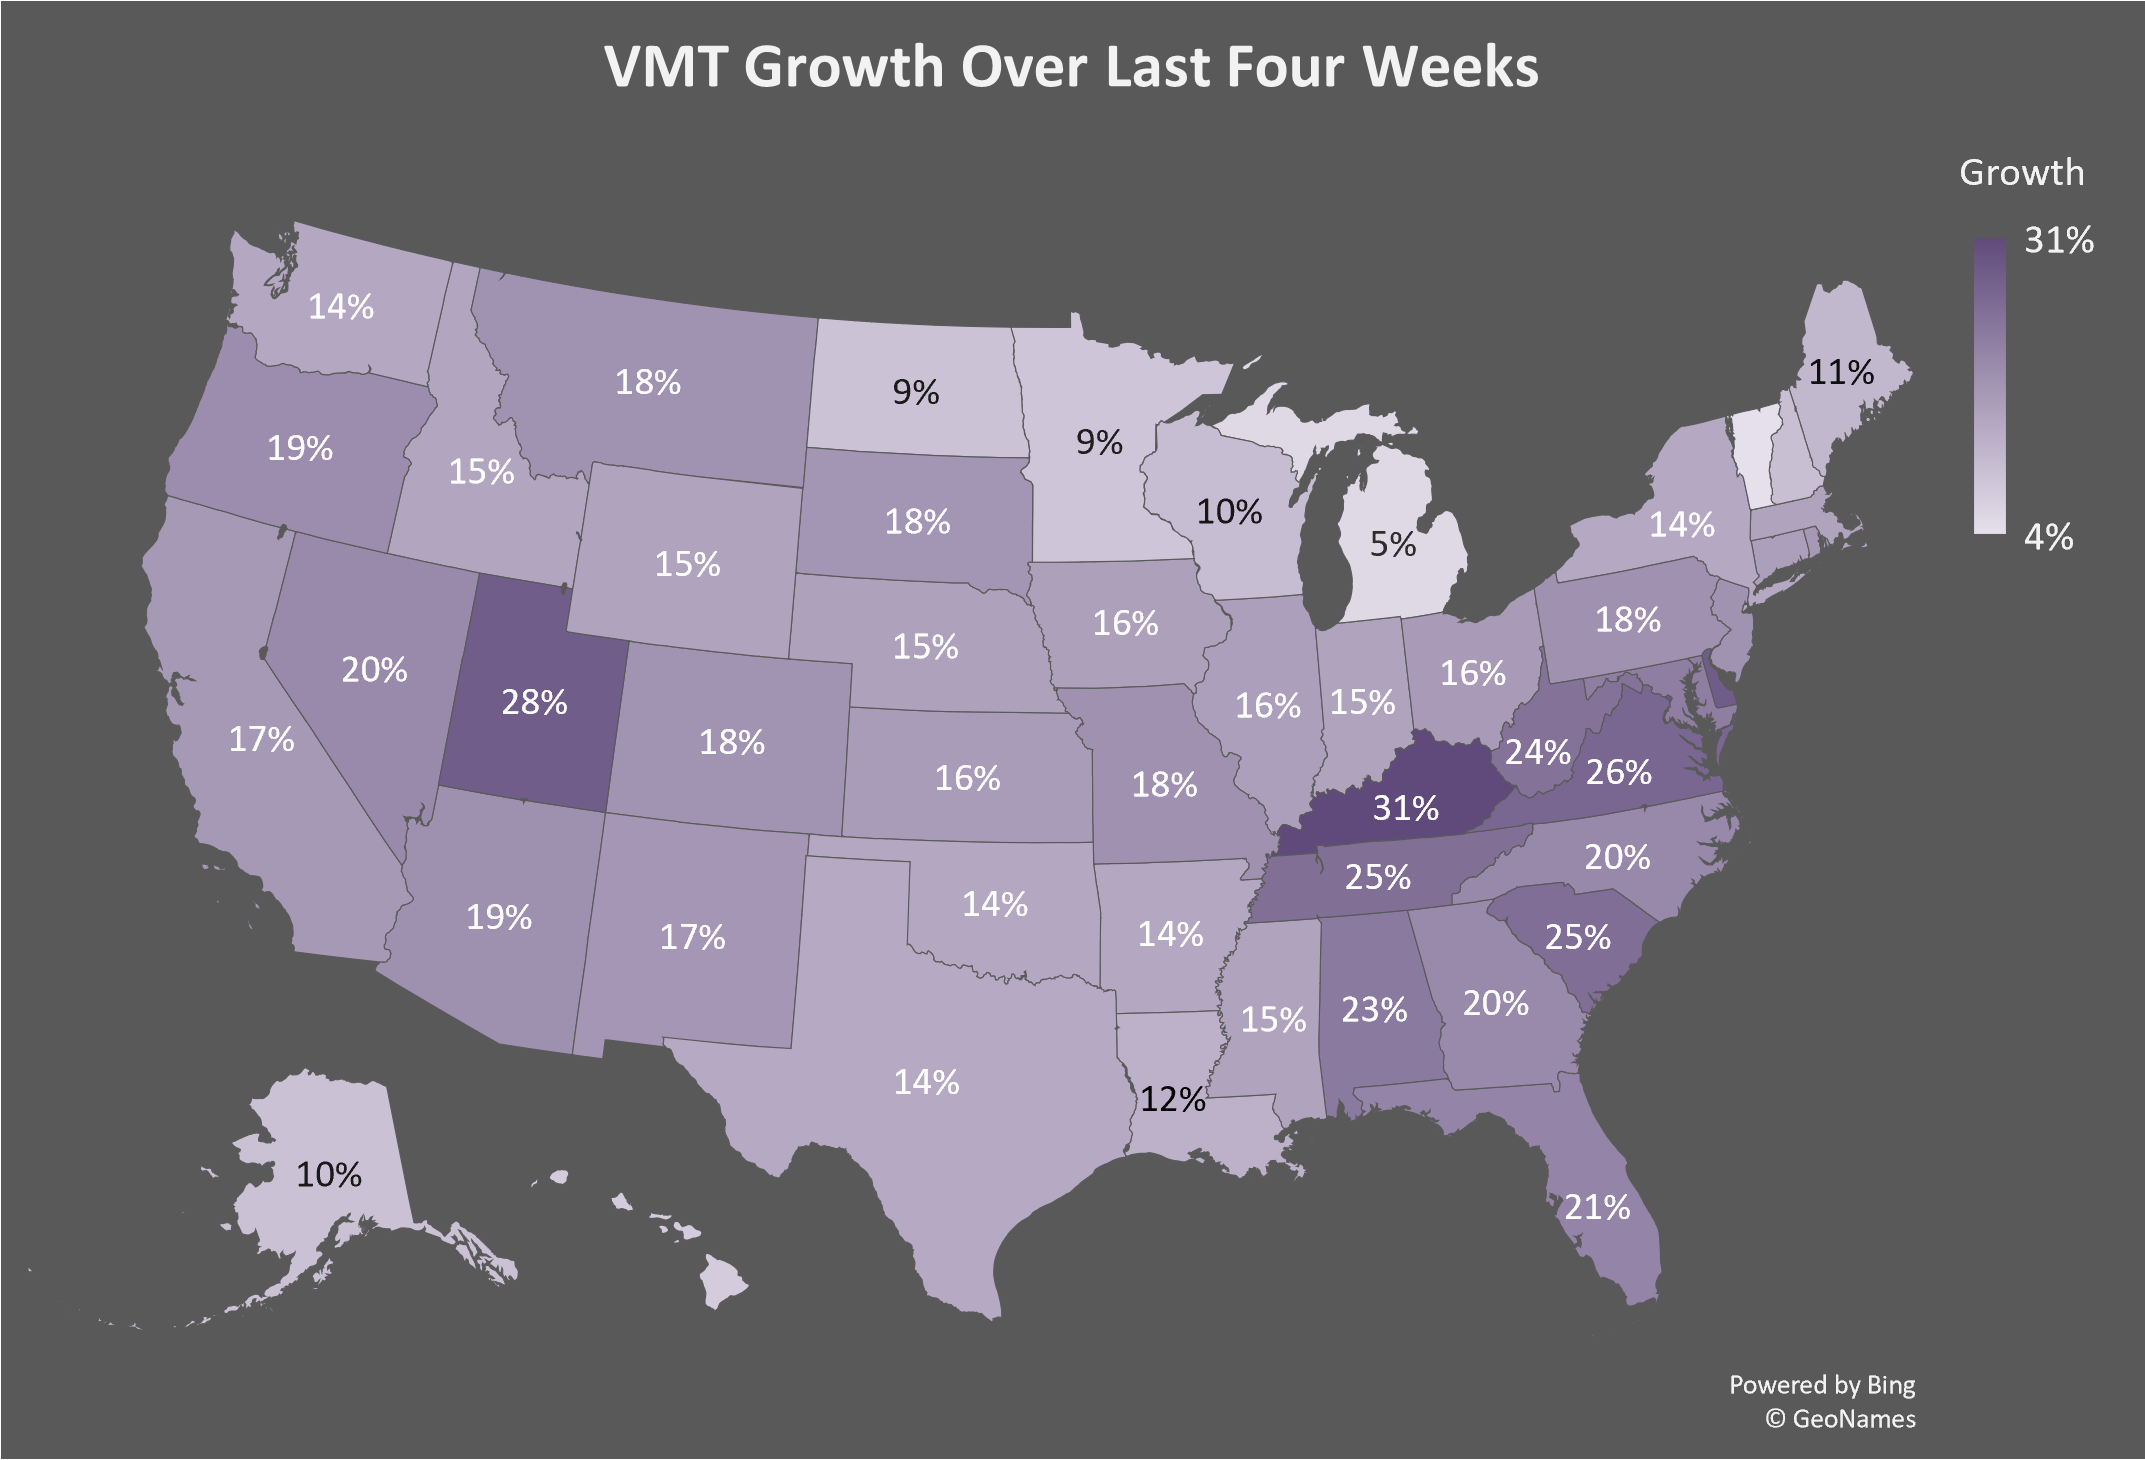
Yet growth in VMT has not been evenly disbursed. Kentucky saw the largest growth in VMT vs four weeks ago with a 31% unadjusted growth in travel. Vermont has seen the lowest growth at 4%. Overall, travel in the Southern United States has seen large increases in VMT over the past 4 weeks as indicated in the map below.
To gain a better understanding of understanding of travel and it correlates to COVID-19 and vaccinations, INRIX has compiled official vaccination data by state (healthdata.gov), case data from the New York Times, and VMT from INRIX Trip Analytics.
You can see weekly statistics (Vaccinations, Cases, VMT) for each state below:
Among states with the highest vaccination rates, VMT has significantly grown in New Mexico and South Dakota significantly. Maine and New Hampshire have had large increases in vaccinations, yet have seen significant growth in COVID-19 cases, perhaps influencing VMT numbers – keeping VMT growth slower than other highly-vaccinated states.
|
Since Mid-January |
|||
|
State |
% Vaccinated | COVID Cases | Growth in VMT |
|
New Mexico |
40% | 19% |
33% |
|
New Hampshire |
38% | 53% | 12% |
|
Connecticut |
37% | 41% | 22% |
| Maine | 36% | 56% |
16% |
| Massachusetts | 36% | 39% |
20% |
| South Dakota | 36% | 13% |
35% |
Simply put, it appears that vaccinations do not necessarily correlate with VMT growth. Just two of the most vaccinated states show large increases in VMT since January. Four out of the top most vaccinated states show relatively high levels of COVID cases and a small growth in VMT. Further, even states like North Dakota (34% vaccinated), Wisconsin (33%) and Iowa (32%) have relatively low or moderate VMT growth – despite high relative percentages of people vaccinated.
Yet among the states with the largest growth in VMT since January, only two (Tennessee and Utah) show a small increase in COVID cases, and all have moderate-to-low levels of vaccinations.
|
Since Mid-January |
|||
|
State |
% Vaccinated |
COVID Cases |
Growth in VMT |
|
Kentucky |
32% |
33% |
47% |
|
South Carolina |
28% |
47% |
41% |
|
Tennessee |
26% |
20% |
40% |
|
Utah |
27% |
21% |
39% |
|
West Virginia |
31% |
34% |
39% |
Similarly, some states with high VMT growth show a high COVID growth rate, while two, Tennessee and Utah, have relatively low COVID growth rates.
In other words, it doesn’t appear vaccinations are tied to more growth in VMT, yet. Under half of the population still has yet to receive one shot of the vaccine, and in many states vaccines were prioritized to people more susceptible to the COVID-19 virus, like aging adult communities, essential workers, and those with conditions that put them at greater risk.
Since many states have begun opening up vaccinations to nearly everybody, we will continue to monitor vaccinations, cases and VMT to determine the role of vaccinations in mobility.