


This is the 14th edition of a weekly review of changes in road traffic demand in the United States from the COVID-19 virus spread and our collective response.[1] We will endeavor to publish this Synopsis every Monday for the foreseeable future, providing results through Friday of the previous week. If interested in detailed information with daily updates, we have introduced the INRIX Trip Trends.
Key Findings
- Overall travel continued to increase in Week 14, nearly reaching pre-COVID levels nationwide
- Nationally, when compared to typical travel,[2] Week 14 (Saturday, June 13 – Friday, June 19) saw:
- Personal travel down 3% vs. 7% in Week 13
- Long haul truck travel down 0.7% vs. 3% in Week 13
- Local fleets in Metro Areas down 1.7% vs. 2.2% in Week 13
- Travel decline leaders in Week 13:
- Statewide Personal Travel: Hawaii, down 46% vs. 46% Week 13, and 62% maximum
- Statewide Long Haul Truck Travel: New Mexico, down 10% vs. 12% Week 13, and 21% maximum
- Metro Area Personal Travel: Honolulu, down 31% vs. 30% Week 12, and 52% maximum
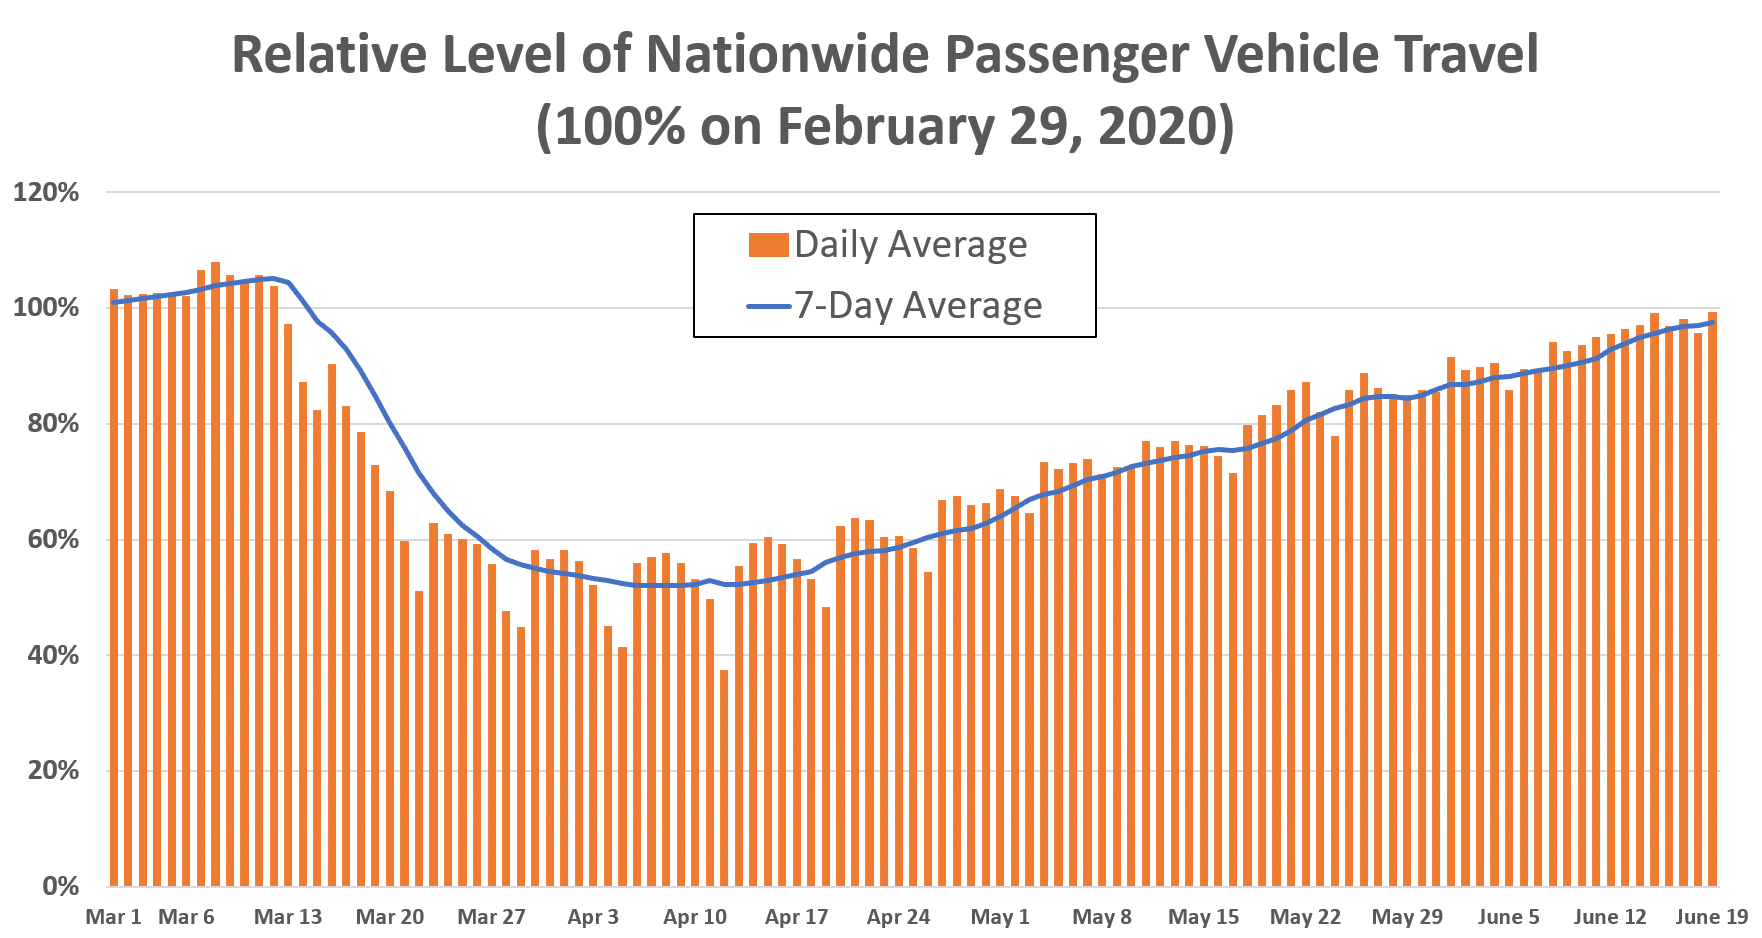
Figure 1
Background
Our incoming data sources (The ‘INRIX Fleet’) provides anonymous speed/location reporting to us in real-time and generates over 100 million trips, traveling over 1 billion total miles per day across the US. The INRIX Fleet provides information about all roads in the national network, not just major roads and spans the full range of vehicle types: consumer vehicles, local fleets, long haul trucks. We have re-purposed our INRIX Trips metadata – with only a 48-hour lag – to generate relevant summary level information about traffic demand.[3]
Synopsis
It has been fourteen weeks since travel began its noticeable decline nationwide. Figure 1 shows the relative change in passenger vehicle travel from March 1, relative to the comparable day of the week during the control week of February 22 – 28, 2020. Figure 1 also includes a weekly rolling average. Passenger travel continued to trend upwards, down 3% weekly on Friday, June 19th, compared to 7% the previous Friday and 48% on April 9th the low point to date. The weekly average was last at 3% on Sunday, March 15th, three days into the initial travel decline.
The daily figure for Friday, June 19th was 99.3%, a level that has not been recorded since the nationwide travel decline began. Figure 2 shows the daily figures each week, illustrating the travel declines stabilizing in Weeks 4 and 5, increasing steadily since then.
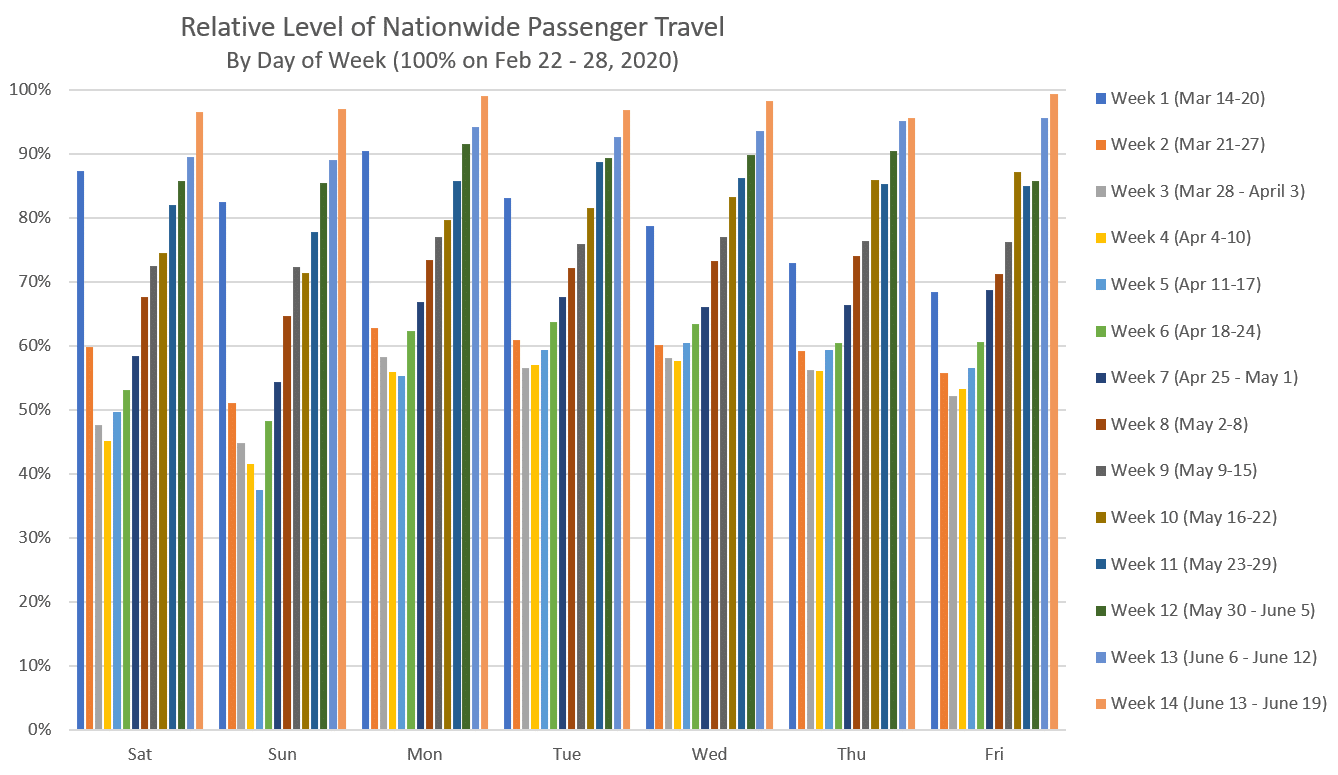
Figure 2
State Level Passenger Travel increased in all but two states compared to last week. Those two states, North Carolina and Hawaii, were unchanged from last week. Table 1 shows weekly levels by state for all 14 weeks since initial travel declines. 29 states now have personal travel exceeding the Control Week, up from 22 in Week 13. Hawaii, with its continued tourism restrictions, now far exceeds all other states with travel decline of 46%. Eight other states, led by New Jersey (17%), had declines of more than 10%. 12 states had declines, but now are under 10%.
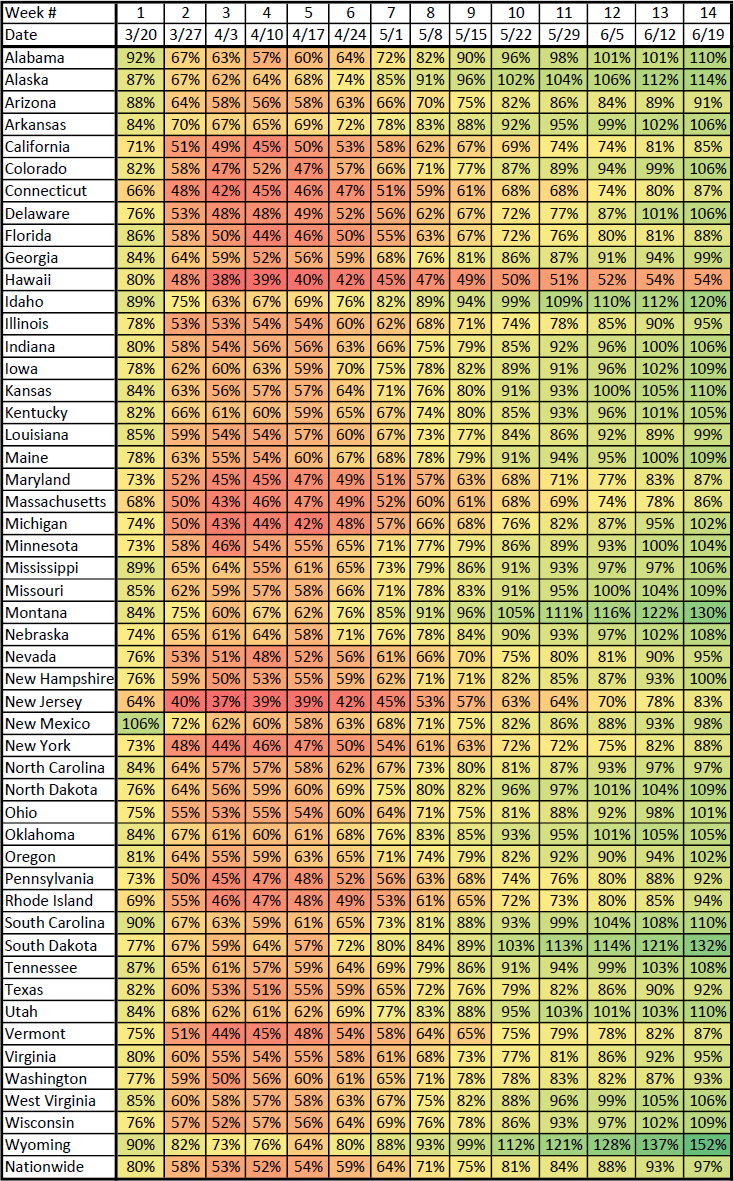
Table 1 – Weekly Average Personal Travel by State – % of Control Week Travel
Nationwide Long Haul Truck travel increased in Week 14, now down 0.7% compared to 3% in Week 13. 30 states now have long haul truck travel exceeding the Control Week, up from 22 states in Week 13. Only two states, Texas and New Mexico, have reductions of 10%. Michigan, which for several weeks had been the most severely impacted state, was down 1% in total in Week 14, nearly fully recovered from a peak reduction of 38% on April 16th.
Metropolitan Area[4] personal travel increased overall again this week, with 93 of the 98 metropolitan areas tracked increasing in Week 14. Five areas, including Honolulu and three in North Carolina, had declines, all under 2%. 25 areas have now fully ‘recovered,’ up from twelve areas in Week 13.
The ten largest reductions in travel in Week 14 were:
- Honolulu: 31% (30% last week)
- Miami: 27% (29% last week)
- San Francisco: 27% (31% last week)
- Orlando: 25% (31% last week)
- Fort Myers: 22% (26% last week)
- New York City: 22% (28% last week)
- Washington, DC: 22% (25% last week)
- McAllen, TX: 19% (20% last week)
- Baltimore: 18% (21% last week)
- Phoenix: 17% (18% last week)
Local fleet traffic in metropolitan areas increased slightly in Week 14, at 1.7% up from 2.2% in Week 13.
Seasonal Adjustments
According to the Federal Highway Administration, the average daily national vehicle miles traveled in June 2019 was 16.5% higher than the daily average in February 2019.[5] The 3% reduction in nationwide personal travel actually understates the true change in expected travel. To simplify, for every 97 miles traveled in the US last week, we could have expected 116.5 miles if not for the virus. Thus, the 3% reduction translates into a roughly 17% reduction, seasonally adjusted. This calculation is included for illustrative purposes and to remind readers that, depending upon when the indices shown in this Synopsis return to ‘normal’ compared to the Control Week, they may or may not indicate full recovery on a seasonally adjusted basis.
INRIX Trip Trends Dashboard Chart of the Week
Each week going forward, the Synopsis will include a chart from the INRIX Trip Trends Dashboard, a service available for licensing. Enhanced Dashboard data includes details at the county and zip code level. Figure 3 shows the trends for the five boroughs of New York City, each is a county, as well as those for Genesee county, the principal county of the Rochester, NY metropolitan area. The Figure illustrates both how upstate New York metropolitan areas were affected far less than the City, as well as how Manhattan (New York County) was and still is being affected more significantly than the other boroughs.
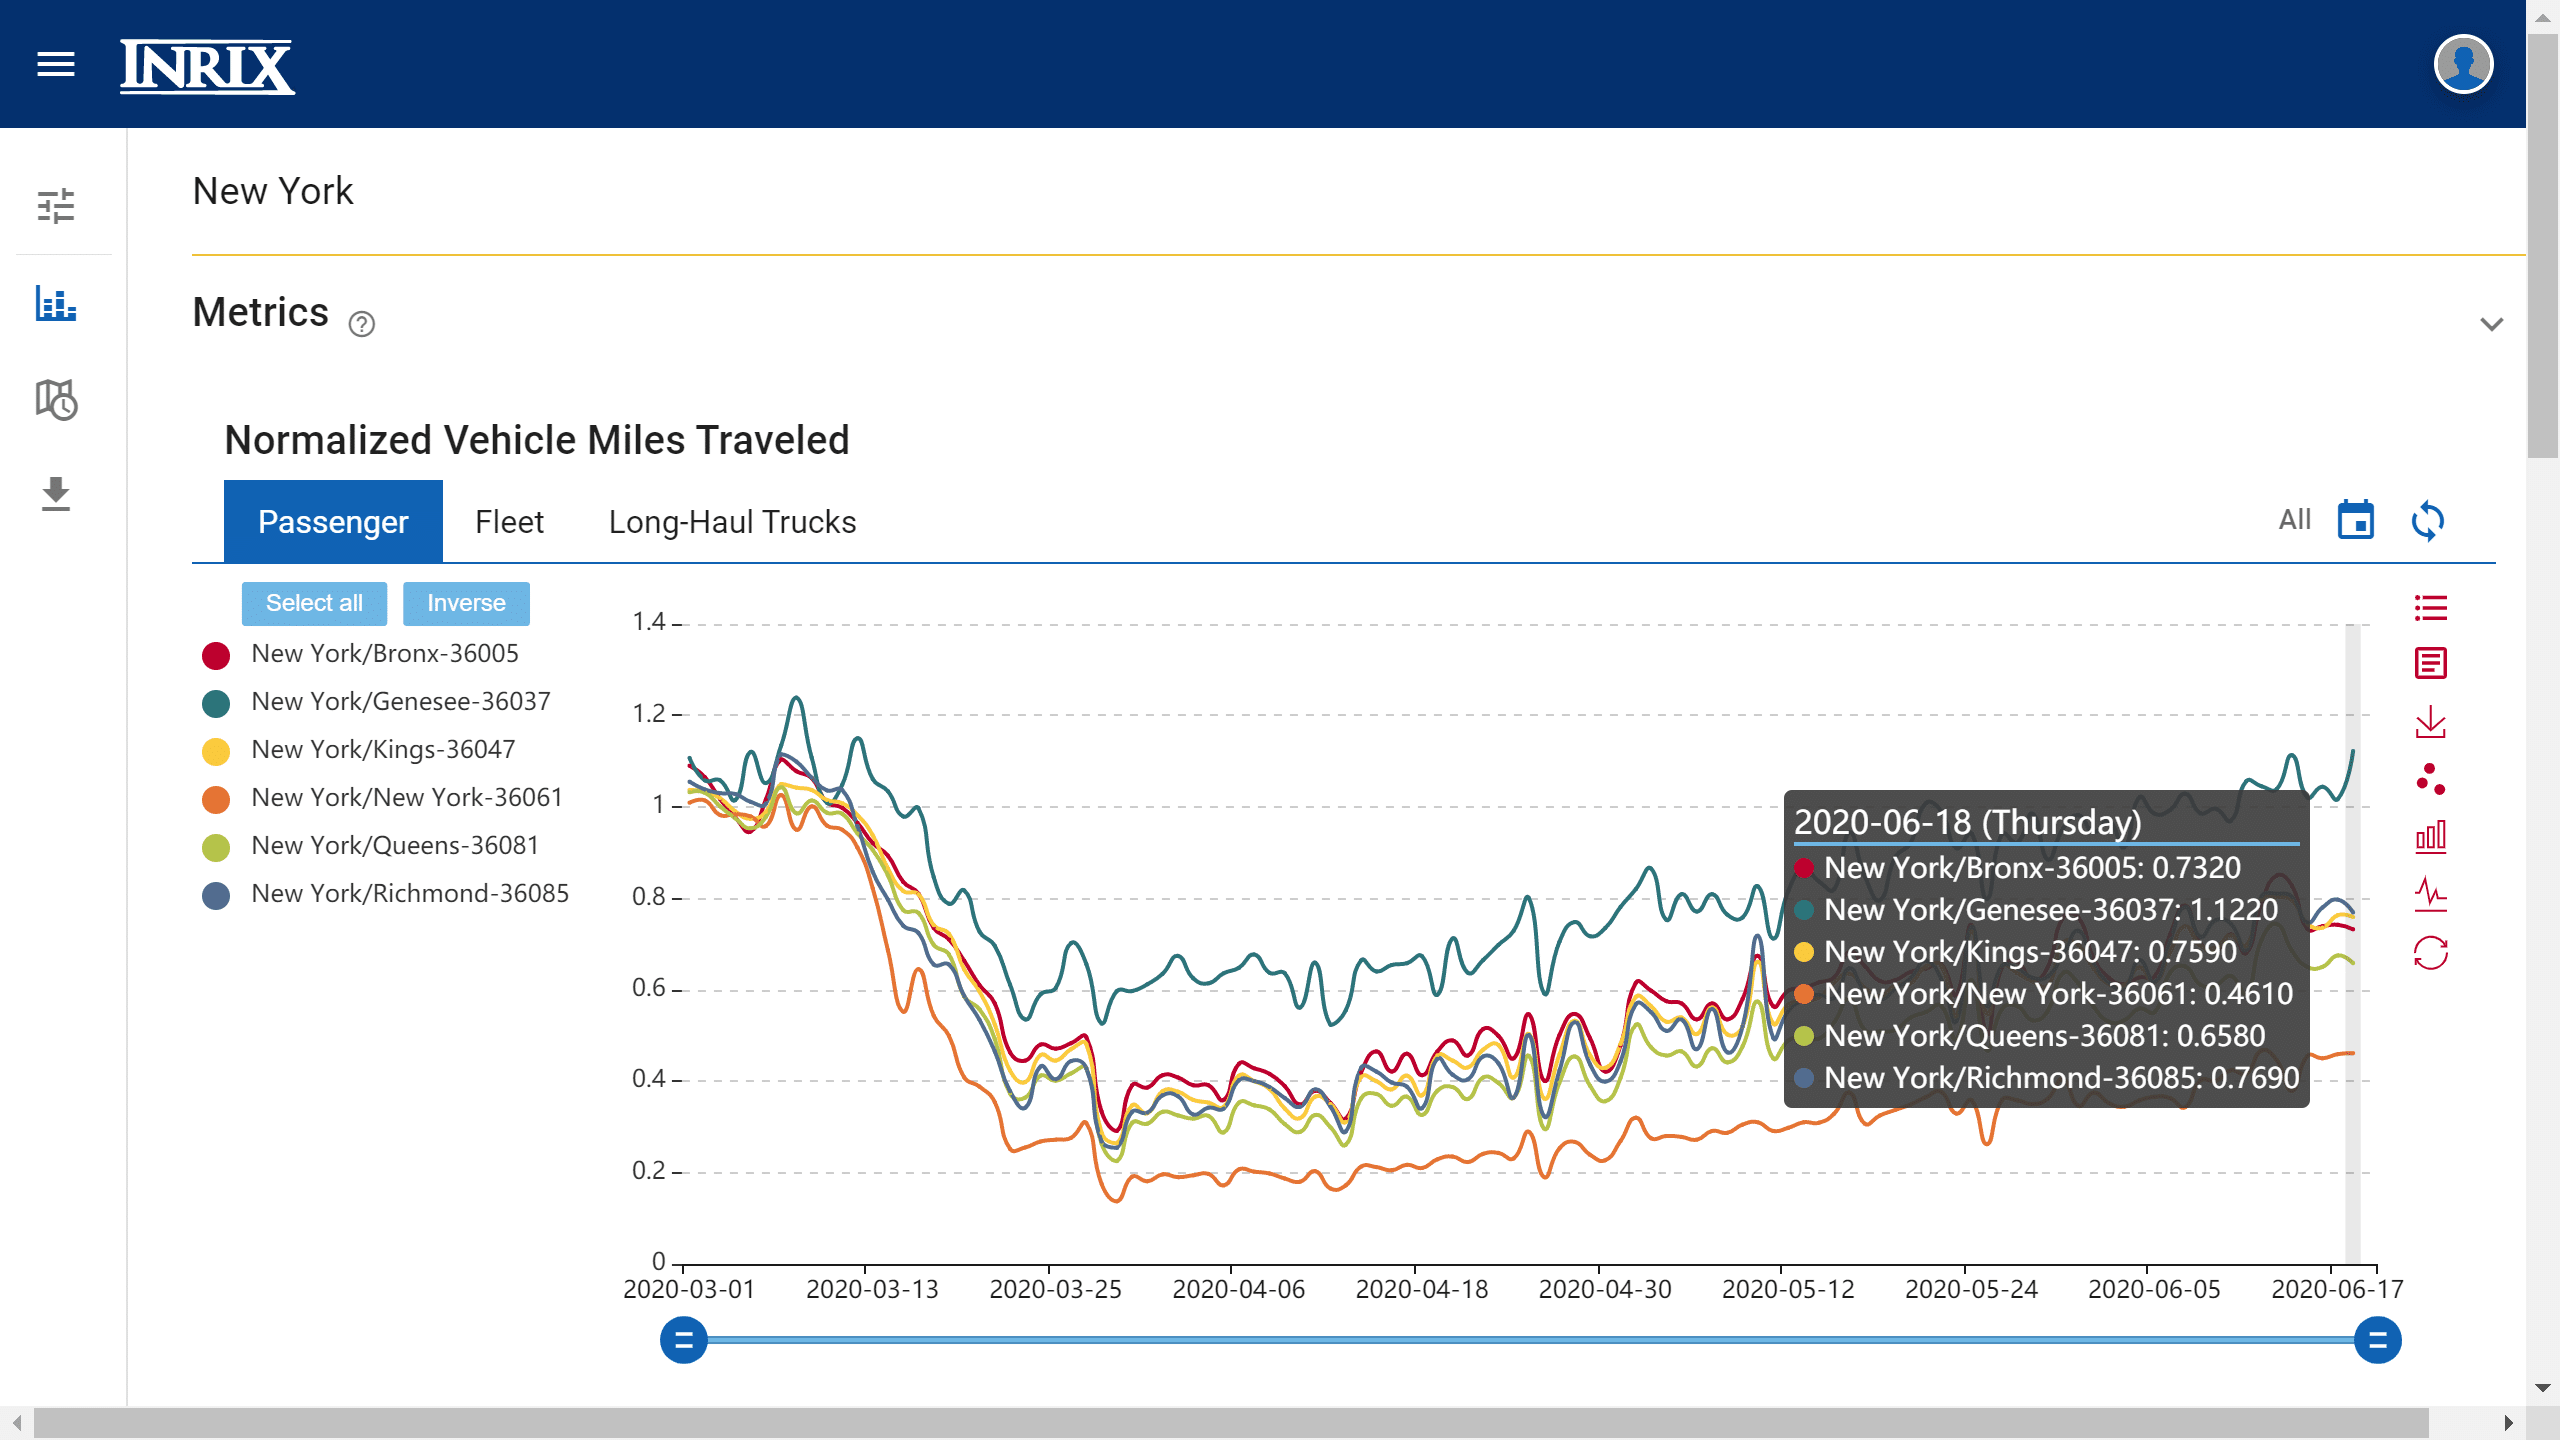
Figure 3 – County level detail in INRIX Trip Trends Dashboard
[1] Previous Issues can be found on the INRIX Blog site
[2] Given the day of week pattern of travel demand, we compare a given day and area to the same day/area in a previous week, and we are using the week commencing Saturday, February 22, 2020 as our ‘control week’
[3] Metadata used is total trip distance of all INRIX Trips originating in the country/state/region each day
[4] INRIX has established 98 metropolitan area geographies for internal purposes; these are the areas used in this analysis
[5] https://www.fhwa.dot.gov/policyinformation/travel_monitoring/tvt.cfm