


By Rick Schuman, VP, Public Sector Americas (rick@inrix.com)
This is the seventh edition of a weekly review of changes in road traffic demand in the United States from the COVID-19 virus spread and our collective response.[1] We will endeavor to publish this Synopsis every Monday for the foreseeable future, providing results through Friday of the previous week. If interested in detailed information with daily updates, we have introduced the INRIX Traffic Trends.
Key Findings
- Travel continued to rebound, particularly personal travel
- Nationwide personal travel at levels last seen on Wednesday, March 25th, over five weeks ago
- Nationally, when compared to typical travel,[2] Week 7 (Saturday, April 25 – Friday, May 1) saw:
- Personal travel down 36% vs. 41% in Week 6, increasing daily since April 15th
- Long haul truck travel down 9.1% vs. 9.3% in Week 6, holding steady throughout the week
- Local fleets in Metro Areas down 16% vs. 17% in Week 6
- Travel decline leaders in Week 7:
- Statewide Personal Travel: New Jersey, down 55% vs. 58% last week
- Statewide Long Haul Truck Travel: Michigan, down 35.0% vs. 35.2% last week
- Metro Area Personal Travel: New York City, down 57% vs. 60% last week
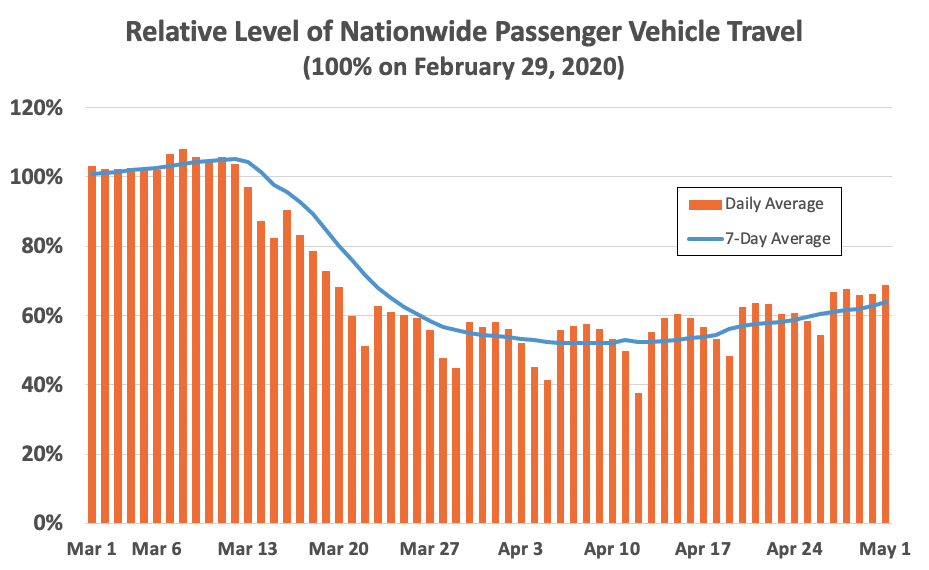
Figure 1
Background
Our incoming data sources (The ‘INRIX Fleet’) provides anonymous speed/location reporting to us in real-time and generates over 100 million trips, traveling over 1 billion total miles per day across the US. INRIX Fleet provides information about all roads in the national network, not just major roads and spans the full range of vehicle types: consumer vehicles, local fleets, long haul trucks.
We have re-purposed our INRIX Trips metadata – with only a 48-hour lag – to generate relevant summary level information about traffic demand.[3] In this extraordinary time, we hope that this information will be useful to policy makers and the public. We look forward to the week, hopefully soon, when we can report on congestion and volume growth – as this will be a sure sign of recovery.
Synopsis
It has been seven weeks since travel began its noticeable decline nationwide. Figure 1 shows the relative change in passenger vehicle travel from March 1, relative to the comparable day of the week during the control week of February 22 – 28, 2020. Figure 1 also includes a weekly rolling average. Passenger travel continued to trend upwards, down 36% weekly on Friday, May 1st, compared to 41% the previous Friday and 48% on April 9th the low point to date. The rolling average was last at 36% on Wednesday, March 25th, more than five weeks ago. The daily figure for May 1st was 69%, a figure last seen on Friday, March 20th, six weeks prior.
State Level Passenger Travel increased in every state compared to last week, for the second week in a row. Maine had the lowest increase (0.7%). Alaska had the highest increase (11%), the only state with a weekly increase of double digits. 26 states increased 5% or more this week. Figure 2 shows each state’s weekly rolling average on May 1st in blue, last week’s (April 24th) in orange, and the maximum drop at any point from March 1st in gray.
All states have recovered at least 7% from their maximum weekly rolling average reduction, with 41 states recovering 10% or more. Montana has had the largest recovery from its maximum reduction of 25%, from 40% to 15%.
Nationwide Long Haul Truck travel increased modestly in Week 7, down 9.1%, compared to 9.3% last week. Half the states had increased truck travel, while half declined, and in most cases state-level changes were minor. Only six states registered a change of 3% or more for the week. Vermont (7%), Alaska (7%), West Virginia (5%), and Maryland (3%) increased more than 3%; North Dakota (4%) and Rhode Island (3%) decreased more than 3%.
Through Week 7, only Arizona is at its maximum reduction in truck travel, down 11%. 15 states have overall reductions in truck travel exceeding 10%, compared to 16 states last week (West Virginia was removed from the list), still led by Michigan (35%) and Texas (19%). 11 states, now led by Nebraska, have increased truck travel compared to the control week, versus six states last week.
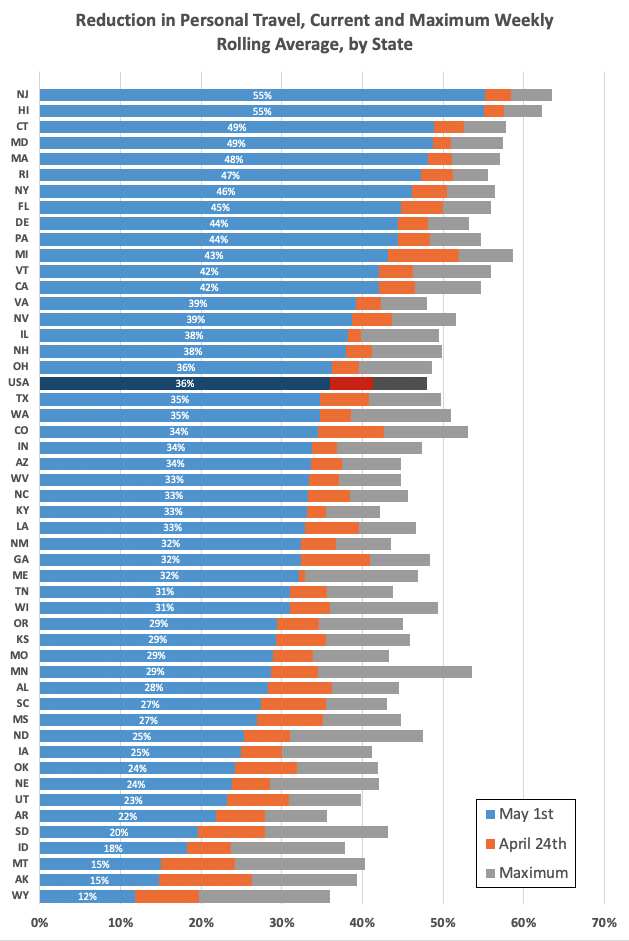
Figure 2
Metropolitan Area[4] personal travel continued to increase overall this week, with all 98 metropolitan areas we track in this Synopsis increasing week over week for the second consecutive week. One area saw weekly increases of more than 10%.
All areas still have declines in personal travel of over 25% compared to the control week (last week all had declines in excess of 30%). Eight areas still have declines over 50% (vs. 16 last week), 24 areas have declines in the 40%’s (vs. 53 last week) and 53 have declines in the 30%’s (vs. 29 last week), and 13 now have declines in the 20%’s (vs. none last week).
Personal travel has increased 10% or more from peak reduction in 78 metropolitan areas. Of the 20 with less than a 10% increase from peak reduction, Washington, DC has the least ‘improvement’ at 7%.
Noteworthy Statistics:
- Most Overall Reduction in Personal Travel Compared in Week 7 Compared to the Control Week:
- New York (57%), Orlando (53%), Miami (53%), San Francisco (52%), Washington, DC (52%)
- Least Overall Reduction in Personal Travel Compared in Week 7 Compared to the Control Week:
- Little Rock (25%), Boise (26%), Spokane (27%), Salt Lake City (27%), Visalia, CA (27%)
- Largest Increases in Travel in Week 7 as Compared to Week 6:
- Colorado Springs (10%), Corpus Christi, TX (10%), Mobile, AL (9%), Charleston, SC (9%) Lansing, MI (9%)
- Largest Increases from Peak Reduction (% is Increase from Peak Reduction to Week 7):
- Minneapolis (21%), Colorado Springs (21%), Corpus Christi, TX (20%), McAllen, TX (19%), Spokane (19%)
Local fleet traffic results for Week 7 are more mixed, with increased traffic in 73 of the 98 areas. And while local fleet traffic tends to be more volatile week-to-week in metropolitan areas, no area saw an increase or decrease above 10% in Week 7.
Seasonal Adjustments
According to the Federal Highway Administration, the average daily national vehicle miles traveled in April 2019 was 15.6% higher than the daily average in February 2019.[5] Thus, if all else was equal, one would expect roughly a 15% increase in travel the last week in April as compared to the last week in February due to seasonal traffic variations. Thus, the 36% reduction in nationwide personal travel actually understates the true change in expected travel. In a ‘typical’ year, indices computed in this Synopsis would be expected to naturally rise at/near 15% as our method is not adjusting for seasonal variation.
To simplify, for every 64 miles traveled in the US last week, we could have expected 115 miles if not for the virus. Thus, the 36% reduction translates into a roughly 45% reduction, seasonally adjusted. This calculation is included for illustrative purposes and to remind readers that, depending upon when the indices shown in this Synopsis return to ‘normal’ compared to the Control Week, they may or may not indicate full recovery on a seasonally adjusted basis.
[1] Previous Issues can be found on the INRIX Blog site
[2] Given the day of week pattern of travel demand, we compare a given day and area to the same day/area in a previous week, and we are using the week commencing Saturday, February 22, 2020 as our ‘control week’
[3] Metadata used is total trip distance of all INRIX Trips originating in the country/state/region each day
[4] INRIX has established 98 metropolitan area geographies for internal purposes; these are the areas used in this analysis
[5] https://www.fhwa.dot.gov/policyinformation/travel_monitoring/tvt.cfm