


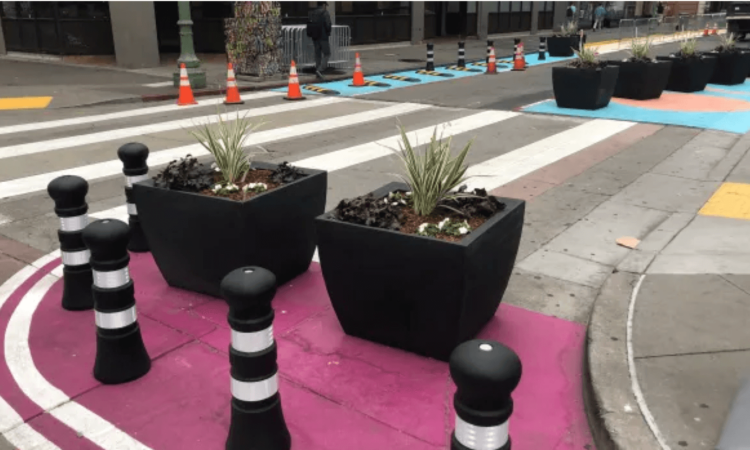
In the world of transportation, demonstration projects, also known as “quick-build,” have gained significant traction as an effective way to implement temporary or impermanent changes to roadways using paint, posts, and striping. These projects offer a valuable opportunity to experiment with innovative ideas, collect data, and inform the design and implementation of permanent projects.
To streamline the process, transportation professionals can leverage the power of Safety View by GM Future Roads & INRIX. In this blog post, we will explore how Safety View’s data insights can help agencies conduct evaluation studies in real-time, without needing to rely on labor and time-intensive manual counts. This rapid evaluation protocol allows practitioners to quickly communicate project impact, paving the way for more impactful and sustainable changes to our roadways.
**NOTE: If you are already familiar with quick-build projects and would just like to get a walk-through of how Safety View can help, scroll down to the use-case section.
What’s the Big Deal About Quick Build Projects?
Quick-build projects refer to small-scale, rapid implementation initiatives that aim to improve road safety and transportation infrastructure in a relatively short timeframe. These projects are typically characterized by their low-cost, temporary nature, and use of flexible materials and designs
Key features of quick-build projects include:
- Speed of Implementation: Quick-build projects can be designed and implemented in weeks and months, compared to traditional infrastructure projects, which often involve lengthy planning, design, and construction processes that take years from concept to concrete. They are designed to address immediate needs and can be deployed quickly to enhance road safety.
- Low-Cost, Flexible Design Solutions: Quick-build projects are often cost-effective and utilize affordable materials and techniques. This allows for testing and experimentation without significant financial investments. These projects can provide valuable insights and data for future decision-making regarding long-term infrastructure improvements. Flexibility and Adaptability: Quick-build projects are designed to be flexible and adaptable to changing circumstances. They can be easily modified, expanded, or removed based on evaluation, feedback, or evolving traffic conditions.
The most common types of quick-build projects include:
- Roadway Adjustments:
Implement new paint, signs, and delineators to redesign streets, ensuring all road users’ needs are met. This can involve adding bikeways and altering travel lanes. - Parking & Loading Updates:
Beyond roadway changes, these projects modify curb space usage, addressing both passenger and commercial loading demands of nearby properties. - Signal Timing Updates:
Enhance signal timings for clearer road user visibility and intersection movements. These adjustments can give pedestrians a crossing head start or assign separate signal phases for drivers and cyclists. - Transit Modifications:
If transit exists on the project route, quick builds may adjust stops or routes. Upgrades can include transforming curbside bus stops into boarding islands to bolster transit efficiency, safety, and bikeway protection.
The SS4A Grant Paves the Way to Expedite Quick-Build Initiatives:
The Safe Streets and Roads for All (SS4A) grant program presents a remarkable opportunity for transportation agencies looking to plan and/or implement vision zero initiatives. The first round of grant funding was announced on February 1, 2023, with a total of $800 million in grants awarded to 510 agencies who applied. The initial grant awards represent an important achievement for the SS4A Grant Program and a positive advancement towards establishing safer and equitable communities that benefit all road users.
This grant was updated in 2023 to include funding for demonstration activities, also known as “quick build” projects, in their proposals, alongside traditional action planning and implementation activities. The 2023 NOFO says that “demonstration activities must measure potential benefits through data collection and evaluation and inform an Action Plan’s list of selected projects and strategies and their future implementation. To receive funds only for demonstration activities through the SS4A program, an applicant must have an existing Action Plan, have a plan that is substantially similar and meets the eligibility requirements for having an existing plan, or be in the process of completing an Action Plan”.
The DOT expects to award at least $250 million in demonstration activities this funding round which provides agencies with the means to explore innovative approaches to improving road safety and efficiency.
Evaluation Studies using Quick-Build Strategies:
Evaluation studies play a crucial role in determining the viability and effectiveness of future permanent projects. By rapidly evaluating demonstration projects, agencies can gather valuable insights and data to inform their decision-making process. Safety View proves to be an invaluable tool in this regard, enabling transportation professionals to analyze the impact of quick-build interventions. Using Safety View’s data-driven insights, agencies can evaluate experiments with impermanent roadway designs, such as those using paint and plastic delineator posts. By studying their impact on traffic flow, safety, and user experience, decisions can be more informed when considering similar permanent changes.
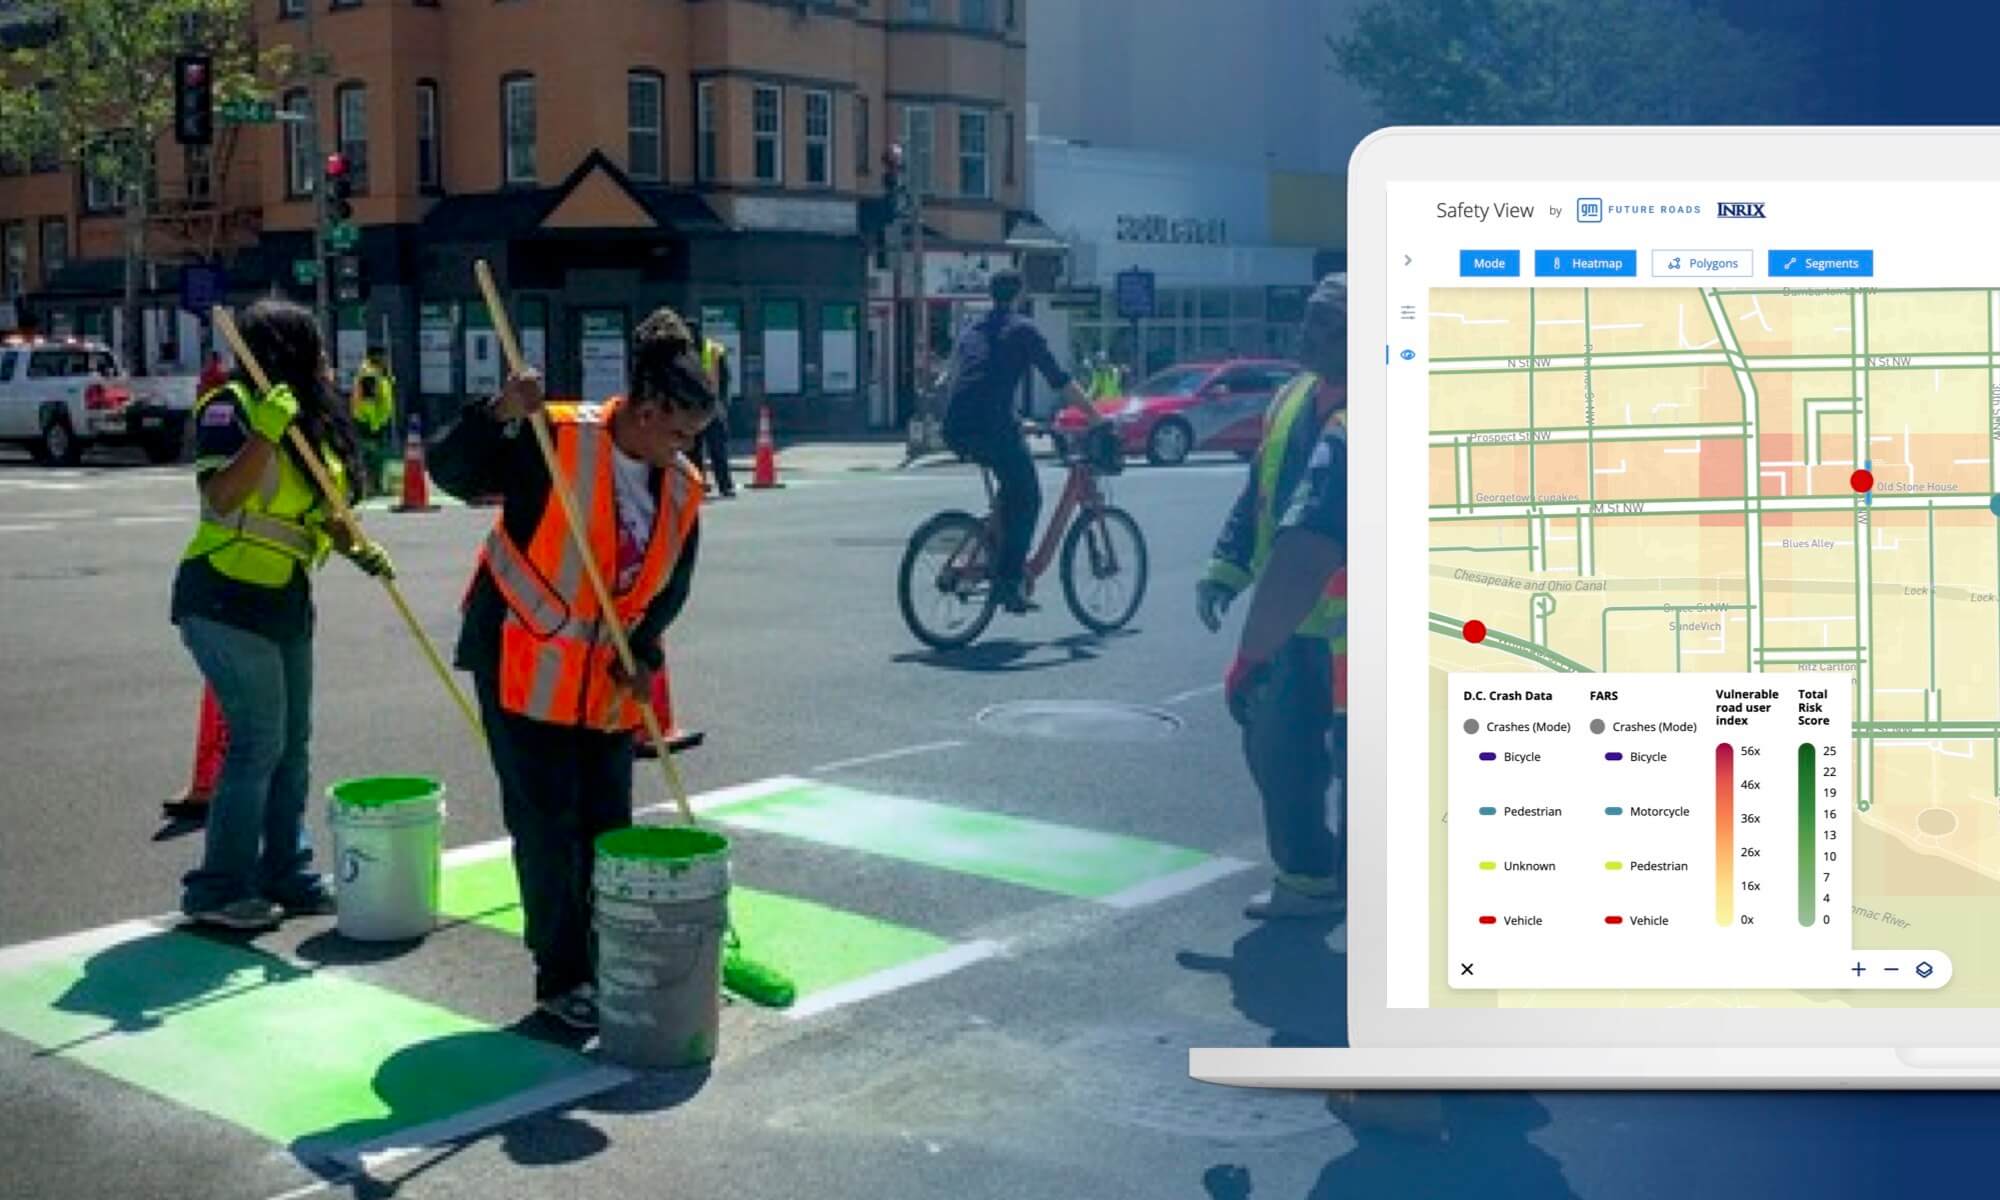
The Role of Safety View:
Safety View is a cloud-based safety analytics application that offers transportation professionals access to critical safety insights. Safety View’s easy-to-use tools can help transportation professionals turn essential safety data into visually compelling, data-driven insights, enabling a deeper understanding of where safety issues occur and the contributing factors.
By leveraging Safety View, agencies can maximize the impact of their quick-build projects and make data-driven decisions that inform future permanent projects
Safety View gives agencies access to numerous valuable data sets that can help them better understand where safety issues exist and where to focus on quick-build projects. Some data sets available in Safety View and their potential use cases are outlined below:
- Speed Distribution Profiles:
Safety View uses vehicle probe data to show a comprehensive profile of vehicle speeds on any given roadway, including a time-of-day analysis. Speed distribution profiles help transportation agencies understand how speeds may be contributing to crash rates. By analyzing these data types, agencies can develop targeted interventions, such as reducing speed limits or improving road design, to reduce the likelihood of future crashes. - Speeders:
Safety View uses open-source speed limit information to present a dataset of “speeders,” or vehicles traveling 10+ mph over the posted speed limit. This will quickly allow you to identify corridors with excessive speeding, which may be good candidates for siting demonstration projects. - Traffic Volume data:
Traffic volume data helps transportation agencies understand the relationship between crashes and congested roadway segments. It can also help identify areas with higher levels of vehicle traffic, which are more likely to have a higher number of crashes. By identifying the segments with the highest volume of traffic, transportation planners can develop more effective safety interventions to reduce the likelihood of future crashes. - Road Segment Risk:
Road Segment Risk provides insights into the level of risk on a particular road segment. Using NHTSA risk profiles as a guide, road segment risk is calculated using aggregated and anonymized connected vehicle data to provide insight into the level of risk present on a particular road segment. Variables include speed, seat-belt use, hard braking, vehicle body size, and crashes.
- Vulnerable Road User Index (VRU)
Finally, the Vulnerable Road User (VRU) Index helps safety stakeholders understand the level of VRU activity on particular roadway segments. VRUs include pedestrians, bicyclists, and motorcyclists, who are more vulnerable to severe injury or death in the event of a crash. By analyzing VRU activity on roadway segments, practitioners can develop targeted interventions to improve safety for these vulnerable users. The VRU index can also be used to compare roadway segments based on VRU activity and ensure that equity considerations are integrated into safety planning.
Safety View can Help you Quickly Get the Insights Needed to Inform Permanent Projects:
The ultimate goal of quick-build projects is to quickly collect data and insights that can inform future permanent projects. We’re going to walk you through how you can use Safety View’s capabilities to get a comprehensive understanding of the effectiveness and impact of quick-build strategies.
Use Case 1:
Project Areas Where You Plan on Implementing Quick-Build Strategies Are Already Identified
In this scenario, transportation stakeholders have already pinpointed locations that they are working to improve and they’ll be able to analyze baseline data to compare the impact of improvement projects. We’ll be looking at SFMTA’s Bay Shore Blvd Quick-Build Project.
- Step 1: Start By Analyzing Baseline Data at the Location of Quick Build Project:
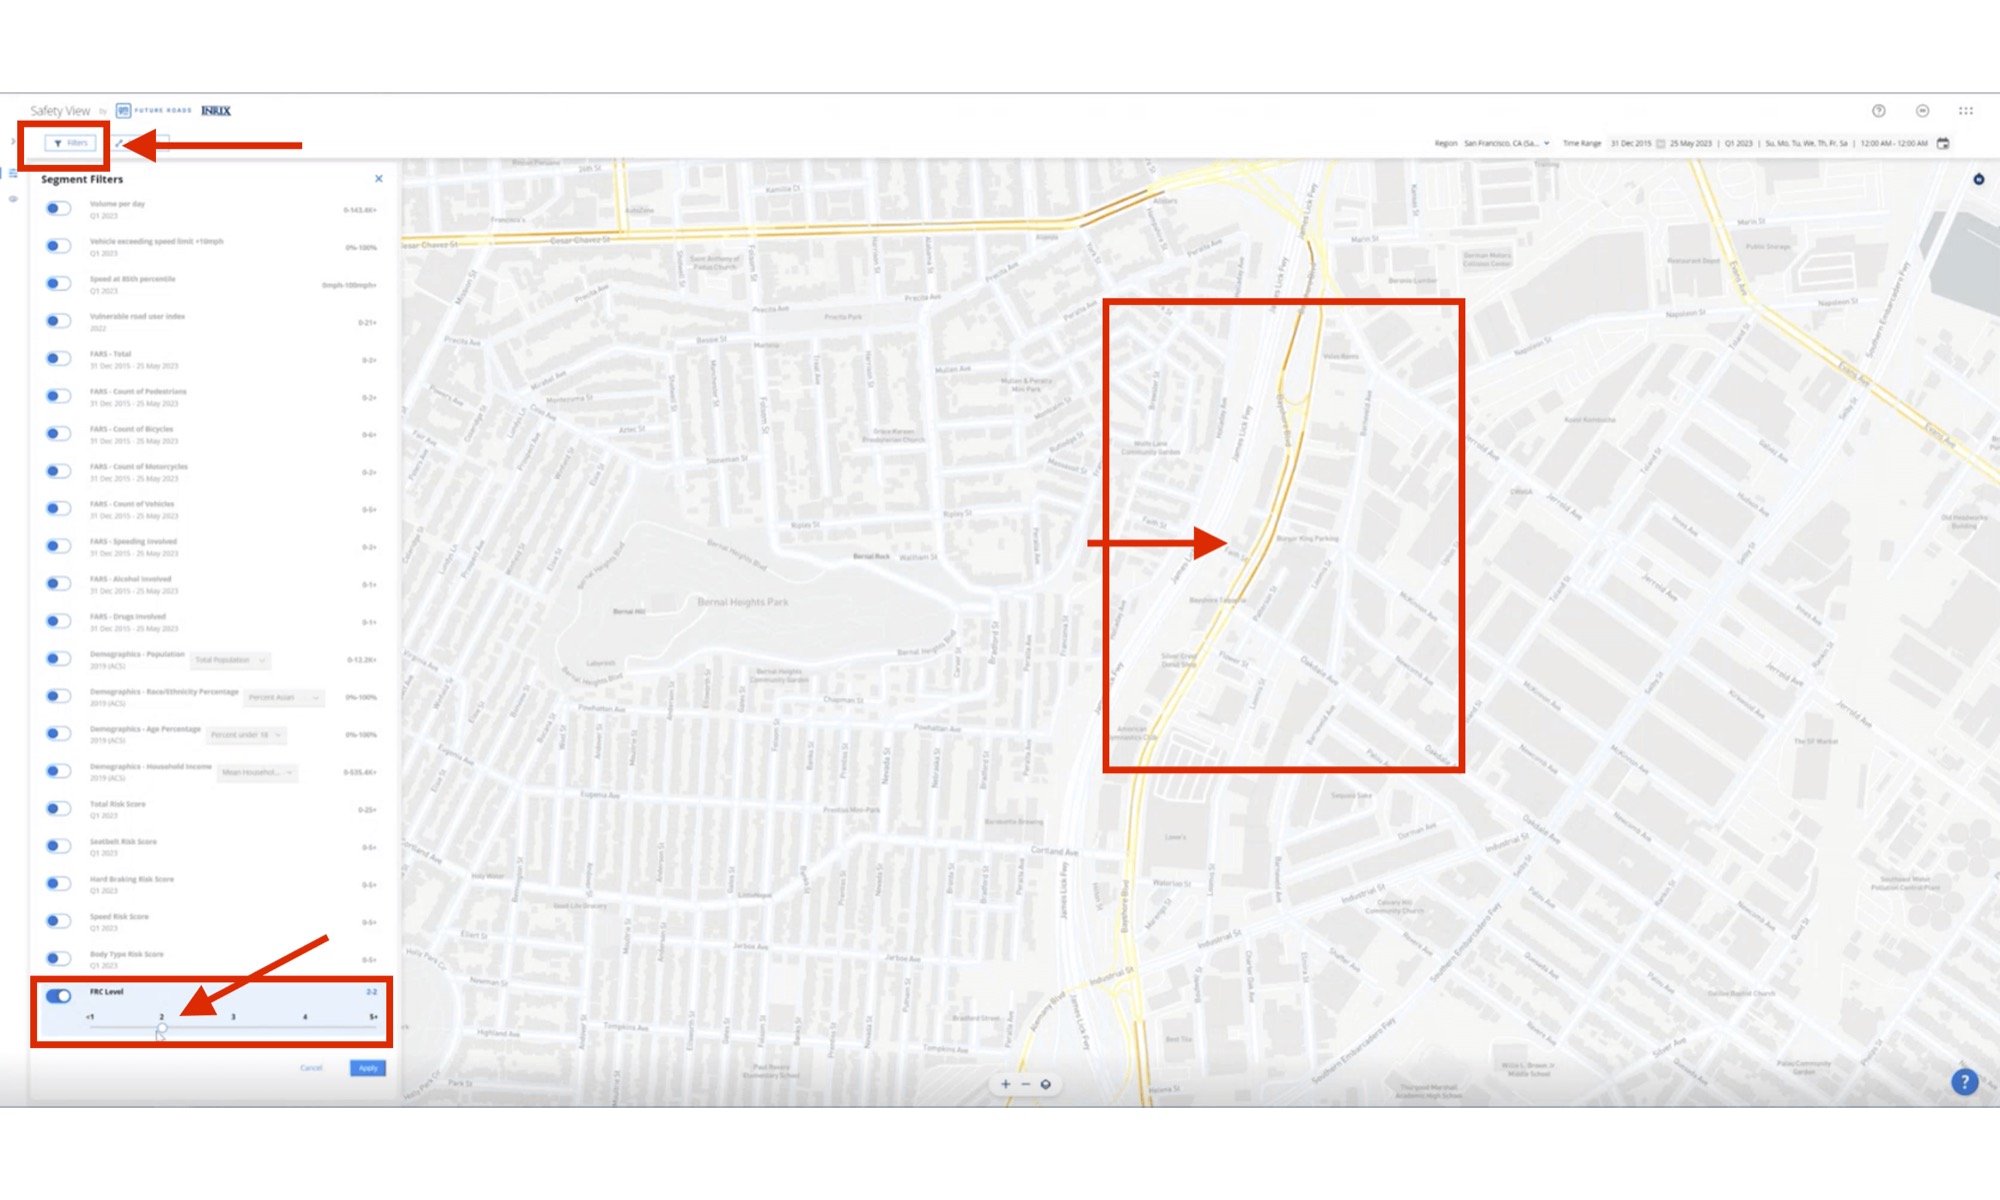
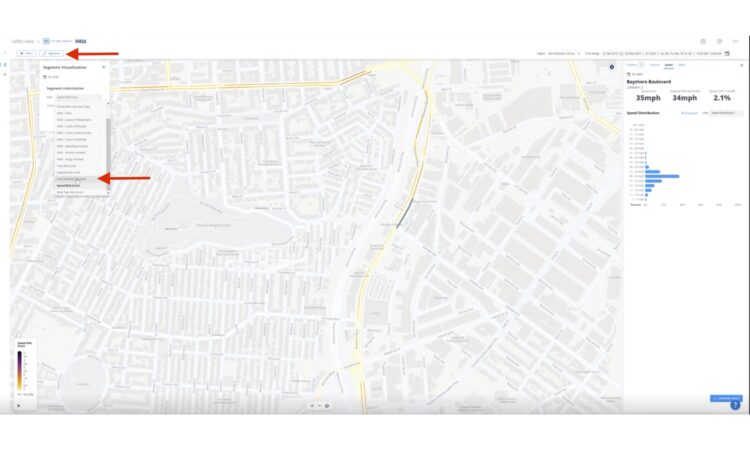
It’s vital to analyze current conditions and build up a database of “Before” conditions that can be compared to “After” conditions later when the project has been implemented.- Open Safety View and in the “Risk Analyzer” tab, search for the location you’re collecting data for on the map.
- In the “Filters” section, turn on the “functional road classification” (FRC) for the road segment you’re analyzing, which in this case is an FRC-2. This way, we can quickly visualize the road segments we’re trying to target.
- Next, click on the road segment where the improvement project is taking place to reveal more details. Under the “Speed” panel, we can see that this stretch of road had about 2.1% of drivers going above 10 mph or more above the posted speed limit in Q1 2023. This is would be the type of data that you would want to download and store to compare to the post-completion data of this project.
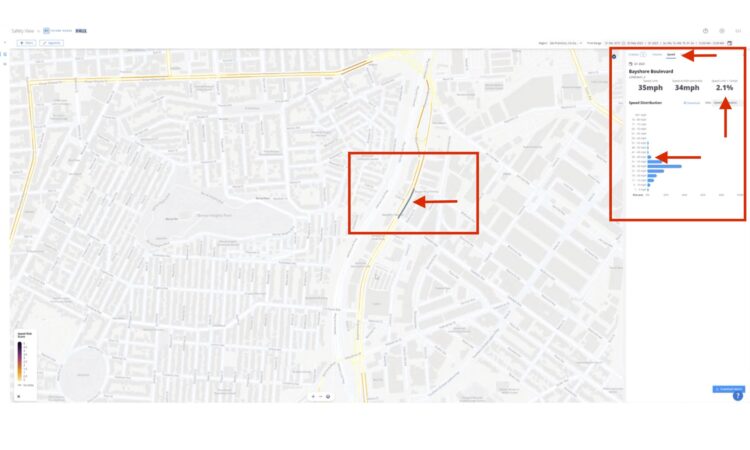
- You can also look at the “hard braking risk score” by turning that filter on under the “Segments” filter section. You can see there is a high prevalence of hard braking on the zoomed-in view of this road segment on the right-hand side.
- Step 2: Analyze Impact of Quick-Build Project Efforts
After the project has been implemented, analyze the same data to see if there were any improvements.
**NOTE: Our development team is currently working on a before/after feature that allows you to do quick before/after assessments with the click of a button.
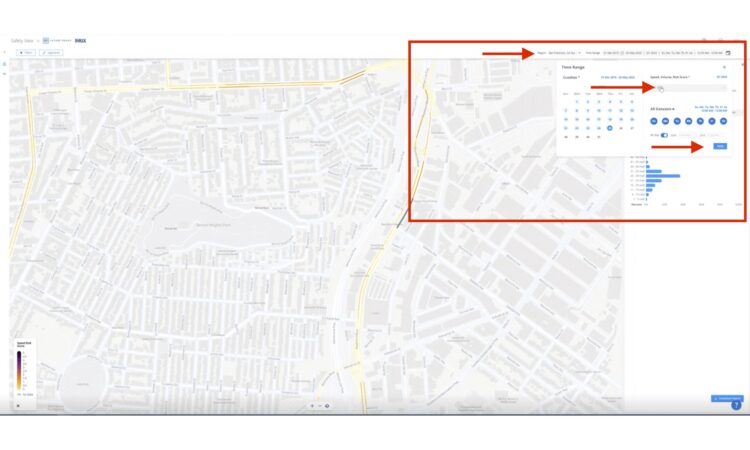
- Follow all of the same steps as before but change the time period to be in Q4 2023 or whatever date you want to analyze post-project completion
Use Case 2:
Pinpoint Problematic Areas To Implement Quick-Build Projects
In this scenario, transportation stakeholders might be looking for areas of improvement so they’ll want to use Safety View to pinpoint potential areas where improvement projects might be needed.
- Step 1: Start By Using Filters to Uncover Dangerous Road Segments:
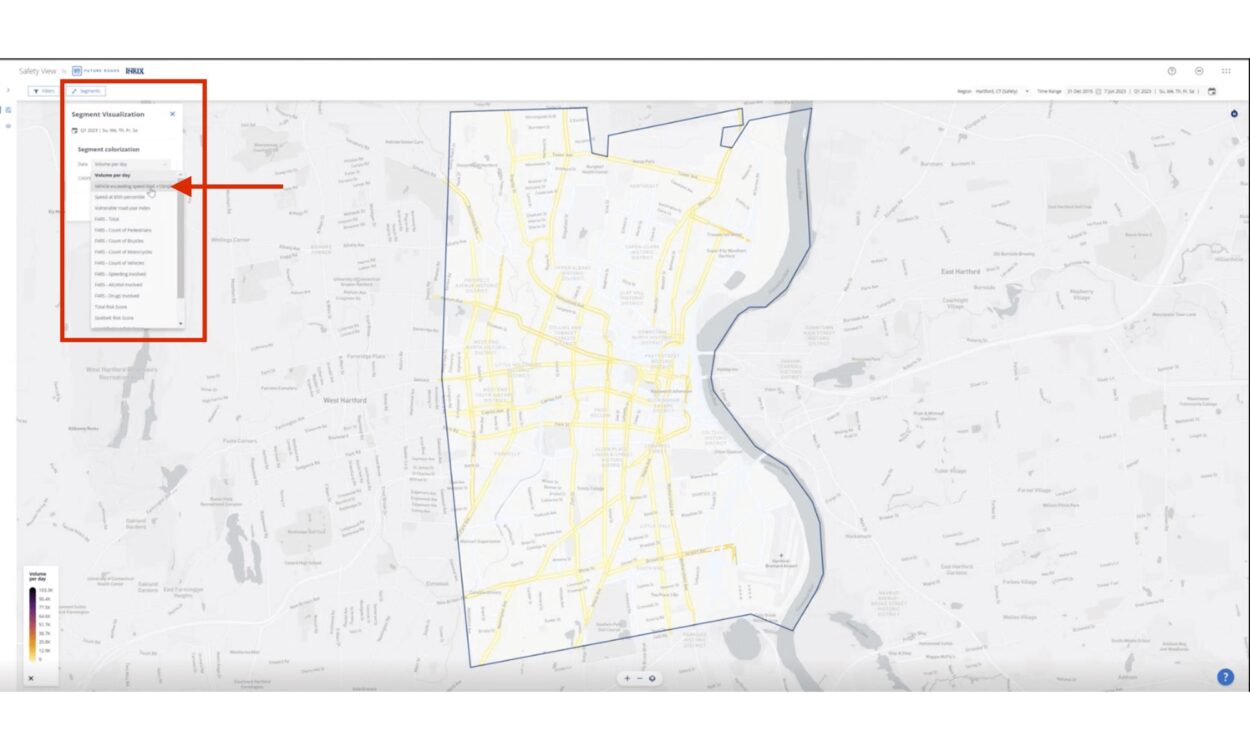
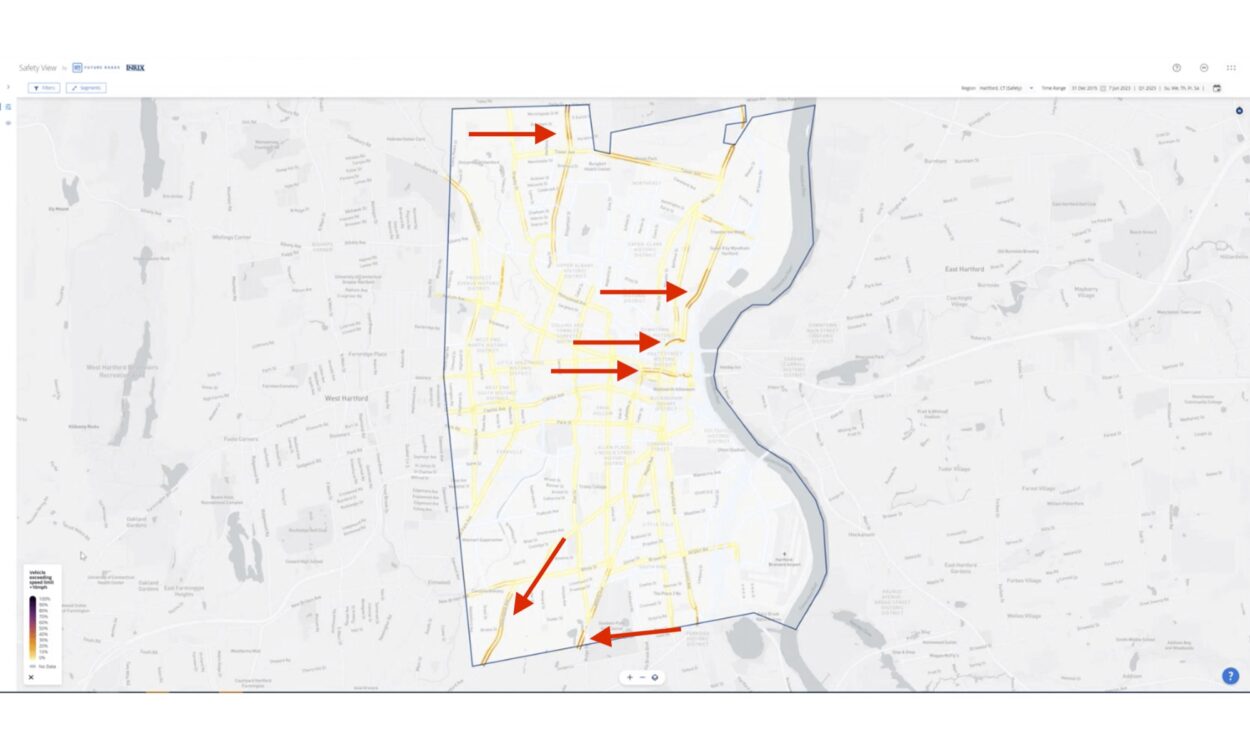
Speed plays a major factor in road safety and is usually the best place to start when trying to identify areas in need of safety improvement projects. For this use case, we’ll use Hartford, Connecticut as an example.- Scroll to Hartford, Connecticut in the “Risk Analyzer” panel of Safety View.
- Narrow the scope of roads to analyze by changing the FRC settings to only show FRC 2 and FRC 3 Roads.
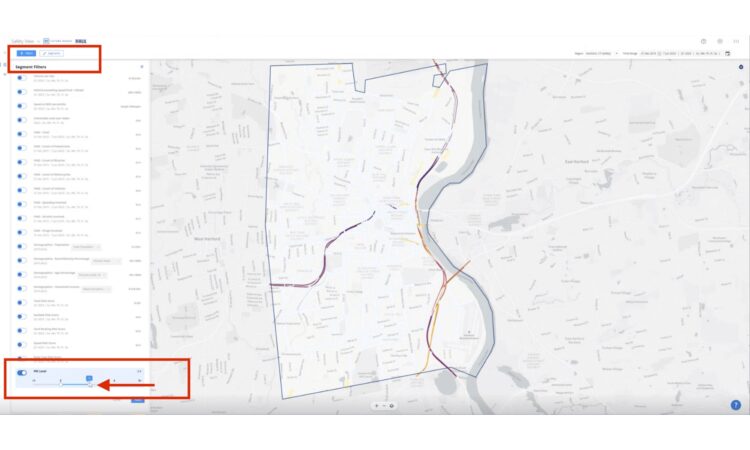
- To get a quick sense of segments/corridors where there are a high percentage of speeders, change the “Vehicle Speed Exceeding 10+ MPH” filter to “20%”.
- Look for corridors/segments that are a darker shade of orange/red to pinpoint areas for further analysis. These sections of road are where there is a higher prevalence of speeding.
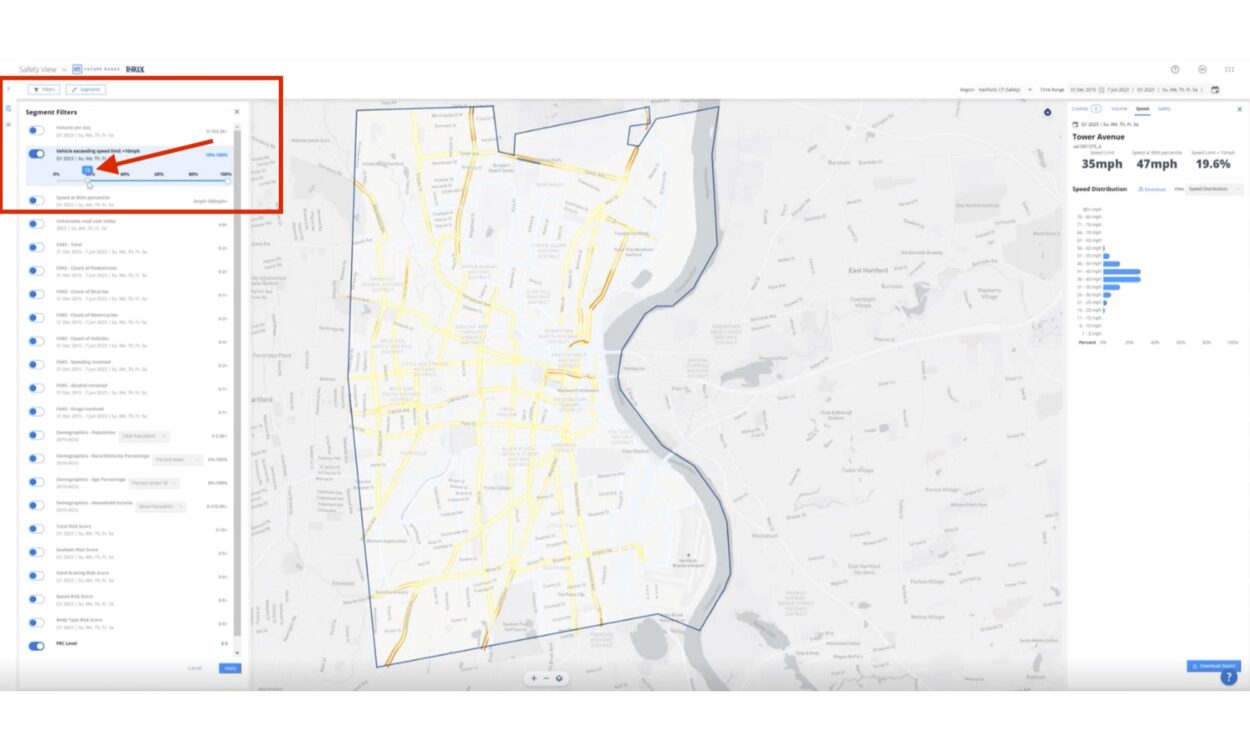
- Step 2: Add Filters to Narrow List of Candidates:
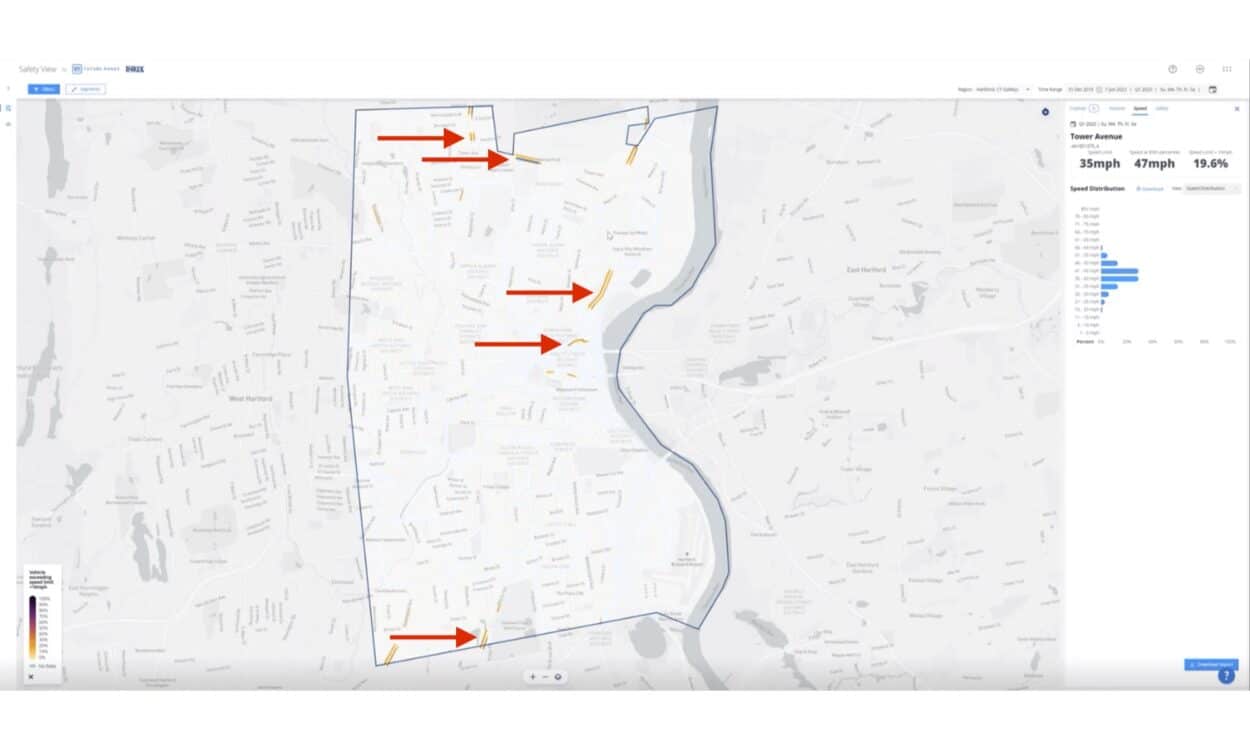
To dig in a bit further, change the “Vehicle Speed Exceeding 10+ MPH” filter to “18%”. By reducing the threshold, you can narrow down the scope of potential areas to test quick-build projects
- With these more stringent filters in place, a clearer picture starts to emerge of where speeding areas are most prevalent. The user can now see 5 prime candidates where taking the next step and in doing a field assessment might make sense.
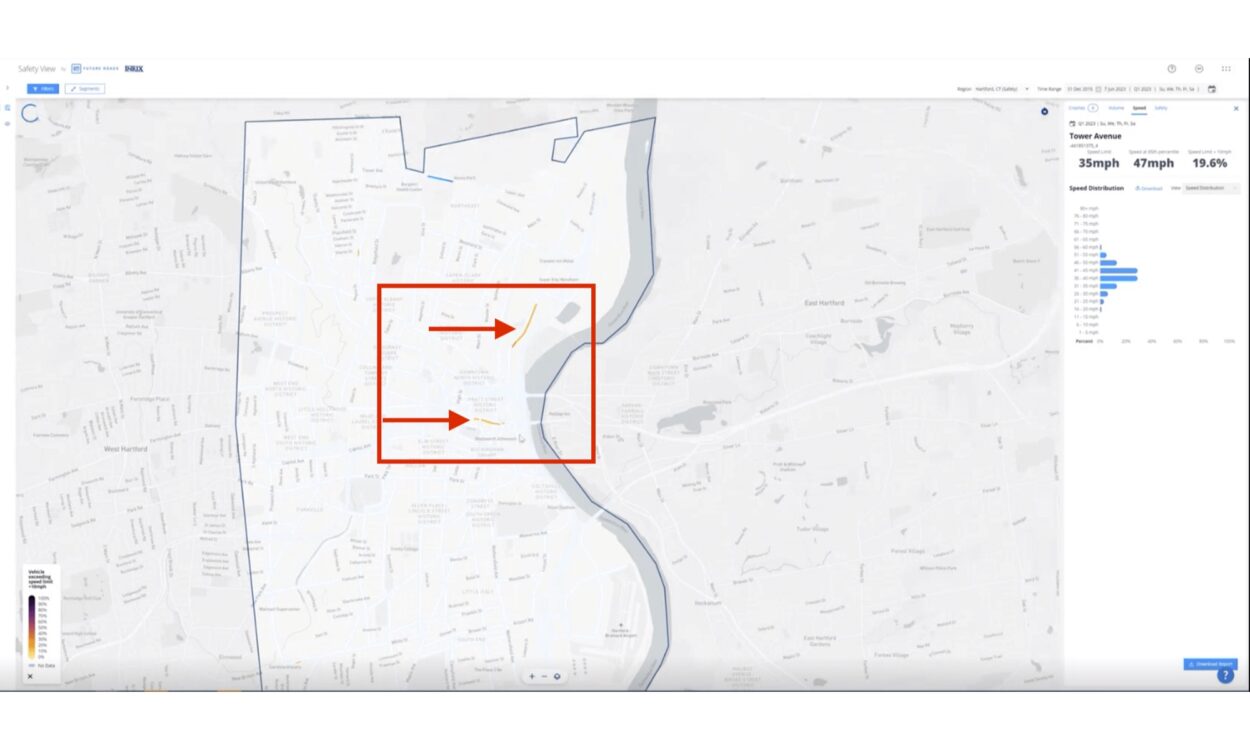
- Step 3: Layer VRU Data On-Top of Speeding Analysis:
Now that we know where unsafe driving speeds are happening we can add another factor into play: Vulnerable Road Users (VRUs). By using the “Vulnerable Road User Index” filter, we can find out which of these corridors/segments also have a lot of VRU activity which can help us pinpoint where safety improvement projects could have the maximum impact.
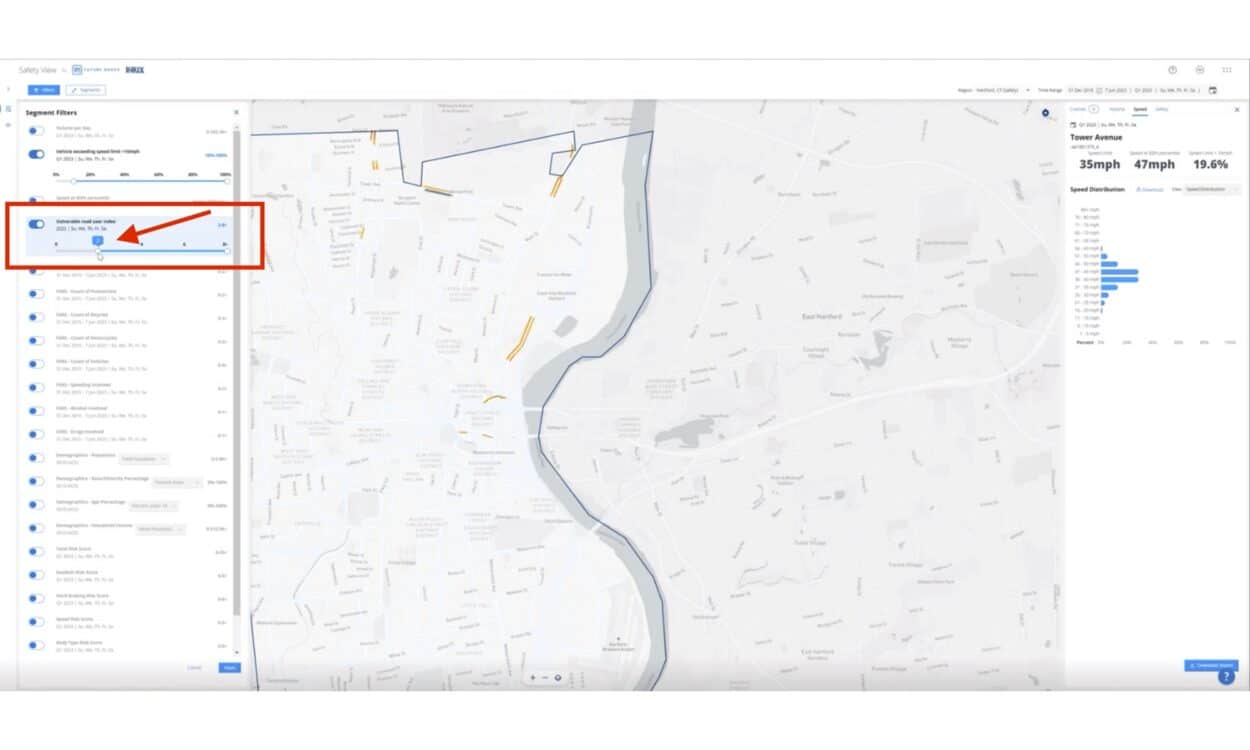
- Once the VRU filter has been applied, 2 prime candidates for quick-build projects emerge. These 2 areas have a higher percentage of drivers traveling at least 10 MPH more than the posted speed limit and a larger volume of road users who are most at risk like pedestrians, bicyclists, etc. Now this agency has a better idea of which locations might be ideal candidates for a quick-build project. Now that we know where unsafe driving speeds are happening we can add another factor into play: Vulnerable Road Users (VRUs). By using the “Vulnerable Road User Index” filter, we can find out which of these corridors/segments also have a lot of VRU activity which can help us pinpoint where a safety improvement project could have the maximum impact.
Conclusion:
In today’s rapidly evolving transportation landscape, quick-build projects offer an exciting opportunity to test and implement innovative ideas that can transform our roadways. Safety View serves as a powerful ally for transportation professionals looking to pursue quick-build initiatives, by providing critical safety data insights that streamline decision-making and enhance project outcomes. By conducting feasibility studies using quick-build strategies and leveraging Safety View’s data-driven insights, agencies can make informed decisions that lead to more effective and sustainable permanent projects.
As transportation professionals embrace the possibilities of quick-build projects, it is crucial to remember the value of collecting data and insights from these interventions. By utilizing Safety View’s capabilities, transportation professionals can navigate the complexities of quick-build projects with ease, ultimately building safer, more efficient, and inclusive streets for all. Let’s work together to seize this opportunity and work to build a future of safer transportation for all road users.
Connect with INRIX to Learn How We Can Help You Achieve Your Vision Zero Goals:
In summary, data analytics tools like Safety View can be extremely helpful for transportation professionals tasked with developing comprehensive, data-driven Safety Action Plans or looking to implement quick-build projects.
Click here to request a consultation from one of our experts or watch this on-demand webinar to learn more.