


Guest Post: Alex Finan, Research Analyst, INRIX
On June 11, 2023, a tanker truck filled with 8,500 gallons of gasoline tipped over on I-95, caught fire and resulted in a partial collapse of the freeway. Pennsylvania Governor Josh Shapiro issued a disaster emergency proclamation to cut red tape and free-up funding to get a temporary replacement span built. The Pennsylvania DOT (PennDOT) avoided the traditionally long and cumbersome bidding process and engaged in the rebuild immediately. PennDOT estimated the repair would take multiple months, however, the temporary span was built in only 12 days – a testament to the value I-95 holds for moving people and goods along the East Coast.
The Penn DOT warned of nightmarish delays in response to the bridge collapse and provided numerous recommendations to curtail the gridlock. News agencies piled on this gloomy picture, forecasting congestion on the roadways connected to I-95. With roughly eight percent of the 160,000 vehicles traversing I-95 daily are trucks, transportation analysts forecasted significant supply chain disruptions. In fact, the Secretary of Transportation Pete Buttigieg said that there was “no question” prices would rise in response to the disaster. With passenger and commercial vehicles experiencing delays and inefficiency, unexpected shipping costs will inevitably push up retail prices.
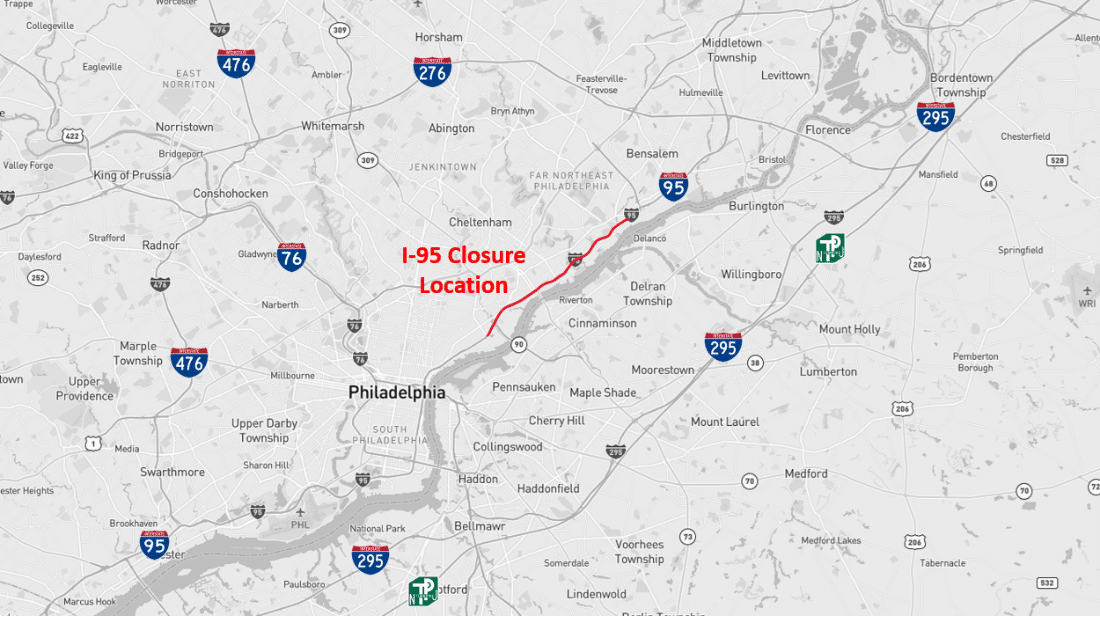
Philadelphia road network and I-95 closure
Despite the forecasted “Carmaggedon,” INRIX traffic data showed that travel speeds on parallel highways were largely unaffected. On direct detours, consumer and freight vehicles, when analyzed in tandem, suggests a 5% decrease in average speed of approximately 2 mph. As the road segments analyzed moved farther from the closure, the congestion minimized. This surprising result is ironically common. The same phenomenon was seen with the collapse of I-85 in Atlanta and closure of Seattle’s SR-99 viaduct for a replacement tunnel. In the case of reduced road supply (for instance, the closure of I-95), commuters shifted to other modes or cancelled their trip entirely, leaving roads unaffected. In fact, it is likely that warnings from government officials intended to reduce demand for road travel– rather than being accurate in their “Carmaggedon” expectation.
With millions of pings daily from a diverse set of sources across the United States, INRIX is well positioned to investigate the effect of the I-95 collapse. Using INRIX’s commercial vehicle dataset, we analyzed freight movement and distribution on the road network surrounding the incident to estimate the severity of these disruptions.
INRIX receives data from two types of commercial vehicles:
- Long haul freight – trucks employed for regional transportation
- Local delivery fleet – as the name implies, trucks which coordinate local operations
Our analysis found that despite predictions, long haul freight experienced minimal delays following the collapse. Comparing the average distance, speed, and volume of trips traversing the affected roads before and after the closure, it became apparent that despite slight increases in average distance, long-haul trucks traveled at similar speeds and volumes. Thanks to a 30% decrease in passenger trip volumes after the collapse, likely due to drivers adhering to warnings, I-295 and New Jersey Turnpike were utilized with little change in average speeds. Both corridors had average speeds around 60mph during the collapse, only 2mph slower than pre-collapse speeds. This allowed long haul freight to continue its operations, mostly unscathed by the forecasted apocalypse.
The results follow findings in other areas of the country around major highway road closures or shutdowns. Often, when public officials warn of impending traffic congestion, passenger traffic volumes fall, especially in the short-term. Additionally, with the onset of the availability of remote work due to the COVID-19 pandemic, peak demand on the road network can be reduced until emergency repair work is done.

The Difference in Avg Distance Traveled for Trucks Impacted by I-95 Collapse
The local delivery fleet did not fare as well. Detour costs were more significant, leading to an 8% increase in the average distance per trip (or around 4 miles of additional transit per vehicle). Since local delivery trucks conduct operations through the Philadelphia city center, many were forced to exit onto city roads at inefficient points.
The heatmap above represents the difference in distance of trips traveling on I-95 grouped by destination. It revealed that freight-related trips ending in proximity to the city center or in proximity to the I-95 collapse experienced the most significant increase in routing distance. Red measures increase in average distance while, blue illustrates neutral or decreases. Thus, although speeds were comparable pre- and post-collapse, local delivery routing in the city drove up supply chain costs for major distributors.
In conclusion, the I-95 collapse showcased the resilience of transportation infrastructure. The rapid response from Pennsylvania DOT and the construction of a temporary span demonstrated the region’s adaptability to unforeseen challenges. While long haul freight operations remained relatively unaffected, local delivery and passenger travel faced more significant disruptions and increased transit costs. Lessons learned from this incident can inform future infrastructure planning and response strategies, emphasizing the importance of efficient emergency management and collaboration between government agencies to minimize disruptions to commerce and daily life.