With rising gas prices and inflation as hot topics this summer, we wanted to see if there has been a change in number of trips taken to popular summer attractions. INRIX specifically looked at Six Flags and SeaWorld, two destinations that typically have a spike in visits and revenue during the summer months. COVID-19 impacted where people were able to gather these past couple of years, causing companies to scale back, creating financial uncertainty. With fuel prices higher than last year and increased inflation, we compared trip counts throughout COVID-19 to determine:
- if in-person theme parks continue to be attractive to the public despite the COVID pandemic;
- the viability of those industries, and tourism in general, moving forward;
- and if revenue & attendance can be shown to correlate with vehicular trip data.
Impacts of COVID-19 on Six Flags & Sea World
Six Flags operates theme and water parks across North America, with 27 properties that saw more than 32 million guests in 2019. However, during COVID-19, many parks were forced to close as a “non-essential business,” severely impacting Six Flags’ bottom line, It wasn’t until Spring 2021 that many Six Flags theme parks fully reopened.
Many Sea World parks only closed for a brief period at the beginning of the pandemic in 2020. Because many locations are often closed in the winters, some parks delayed the opening of their parks until August of 2020. However, many Sea World locations opened year-round beginning in January 2021.
INRIX Trip Analytics reveal Six Flags visit and revenue pattern
INRIX Trip Analytics is an alternative data source for portfolio managers and financial professionals to improve asset allocations. Based on billions of aggregated and anonymized vehicular trip data points, analysts can gain insights into specific industries to easily spot trends and signals to make better investment decisions.
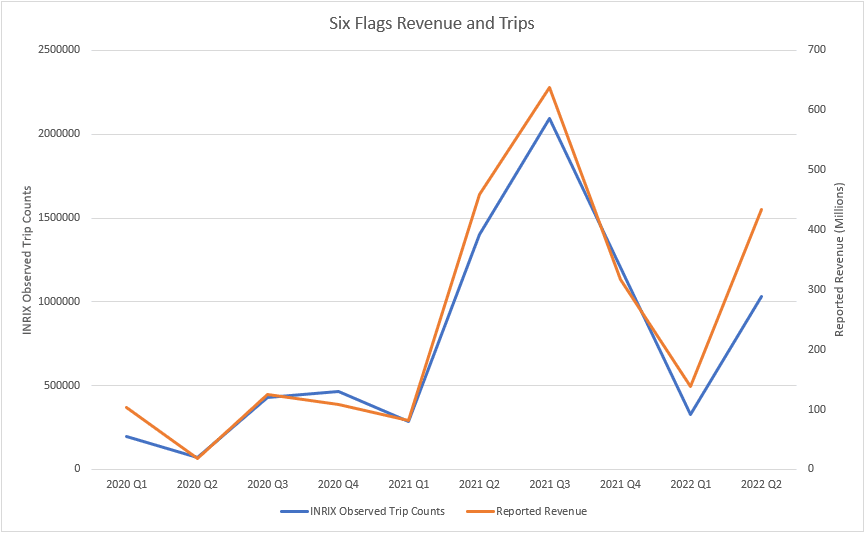
As the chart below reveals, INRIX trip counts follow closely with reported revenue of Six Flags, though the two trends slightly differ Q2 2022.

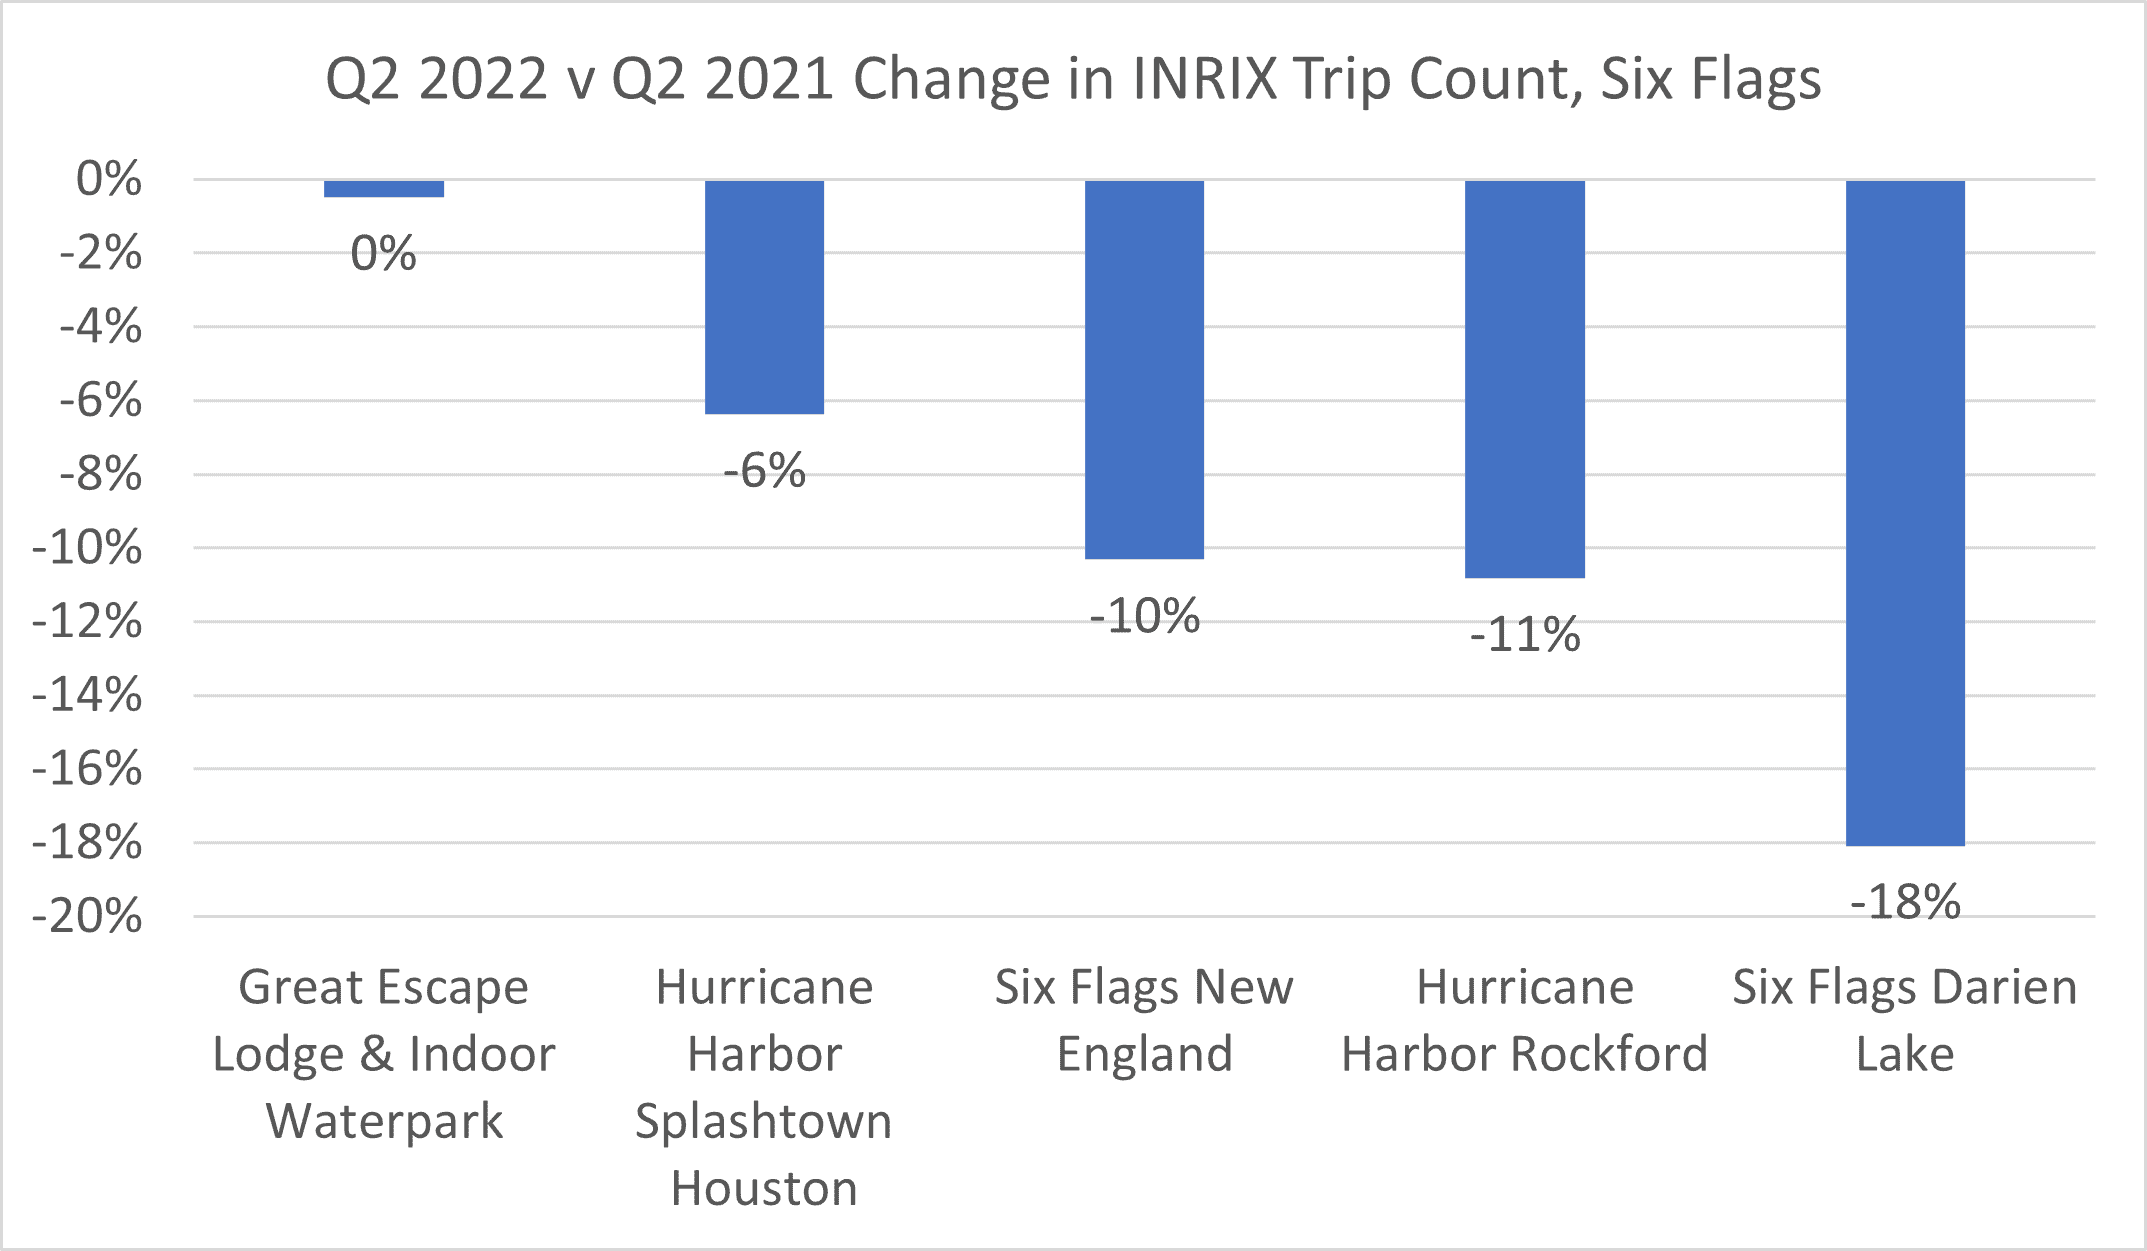
Revenue at theme parks come from multiple sources, like sponsorships, attendance, food, and souvenirs. In short, revenue is not based on attendance alone. As recently discussed on Six Flags’ Q2 earnings call, total spending per guest was $52 in Q2 2021 but jumped to $64 in Q2 2022, a 23% increase. INRIX data highlighted a significant drop in trips to Six Flags as the company reported a 21% reduction in attendance versus the year prior. In the earnings call, Six Flags management notes the decrease in visits were related to the “elimination of free tickets and low-margin product offerings,” along with increases in prices.

However, we can see attendance at certain Six Flags parks with below average reductions in trips, like water parks Great Escape Lodge in New York and Hurricane Harbor Splashdown in Houston.
Unfortunately, the theme park operator missed its quarterly forecasts, as shares dropped 18.7% after earnings reports, though regained most of the loss the following day.
Trip counts are up at Sea World:
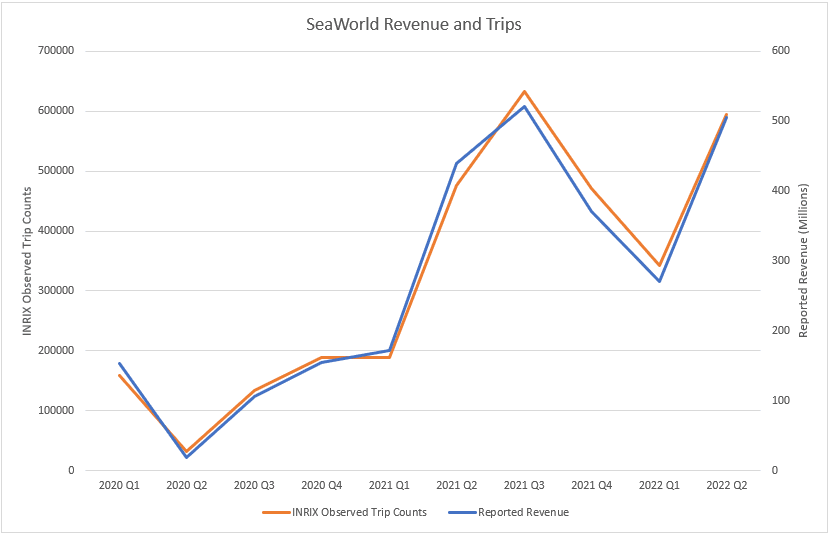
Unlike Six Flags, trips to various Sea World locations in Q2 2022 increased 22% compared to Q2 2021. This is a significant increase in trips considering that many Sea World locations continued to maintain strong trip counts throughout 2021.

The company noted increased attendance as one reason for the sunny results. Attendance at all SeaWorld locations jumped 7.8% in Q2 2022 vs Q2 2021. The company also noted total revenue increased 14.8% over the same time period.
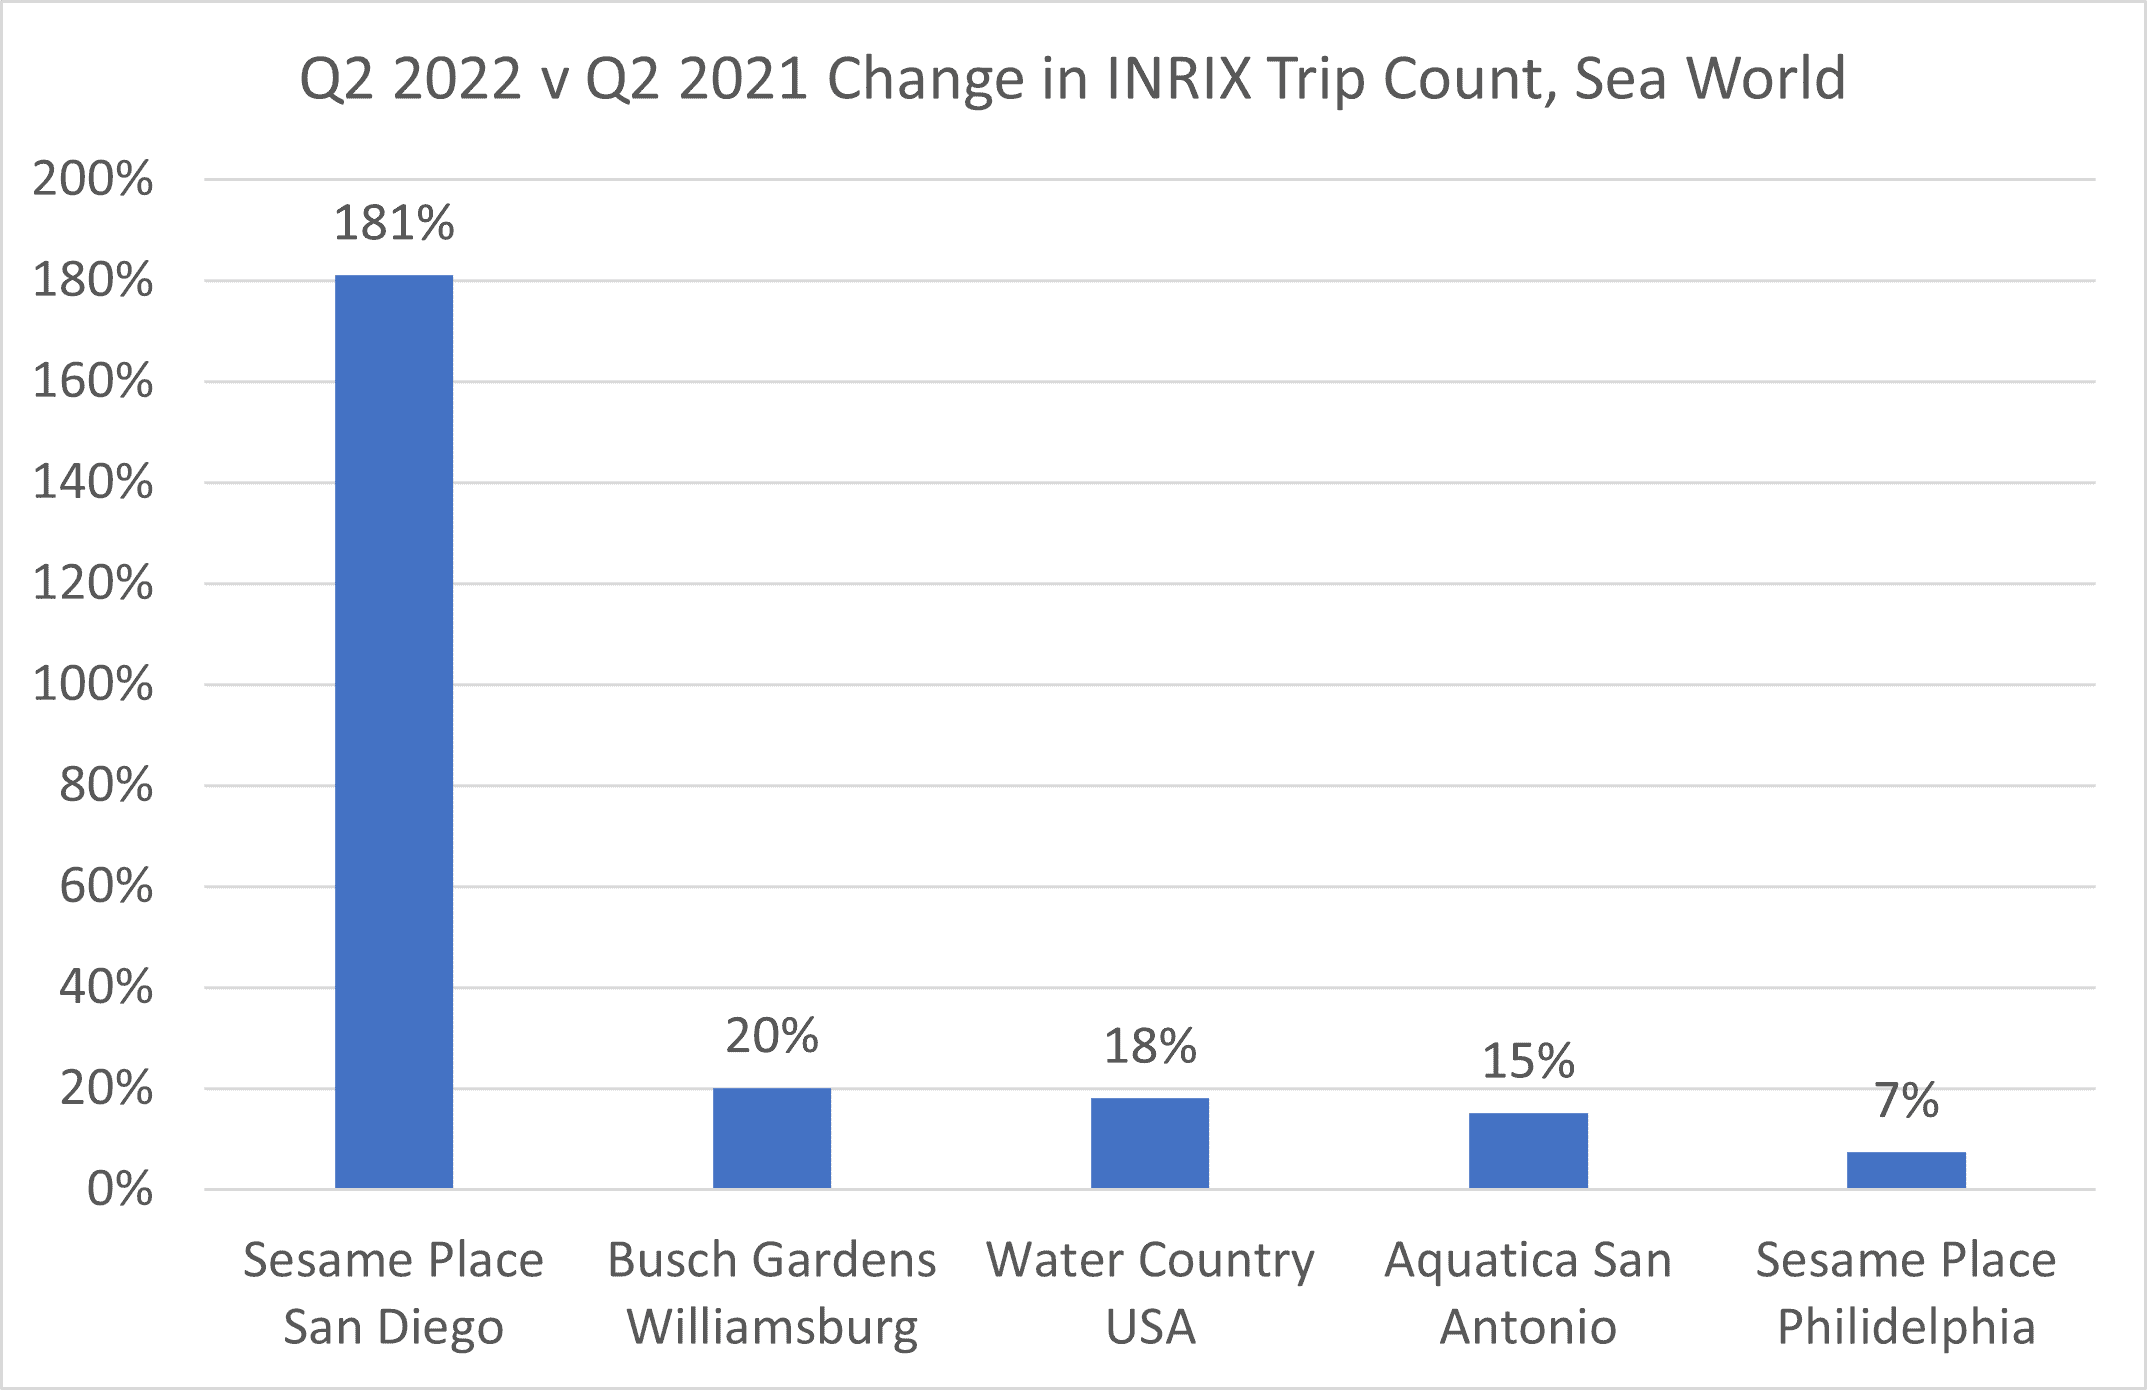
We looked at which locations were experiencing the biggest increased in trip count for Q2 2022 compared to Q2 2021. Sesame Place San Diego is the clear stand-out with a 180% increase in trips. A reason for this outcome may be the rebranding of that location. It officially reopened on March 26, 2022, which likely caused a spike in trips because people were excited to experience the new Sesame Street-themed park. The other parks shown in the chart have experienced increases in trips much closer to the average across all Sea World locations.

This spike in trip counts at Sesame Place, along with the overall increase in trips at Sea World in Q2 2022 compared to last year, show that despite the economic challenges of inflation, fuel prices, and tight labor market, people still value the fun of theme parks.
Conclusion:
Though Six Flags showed a decrease in trips over last year, there is still optimism. Six Flags expects a strong Q3, so monitoring vehicular trip data could provide insight into whether they meet their goal of increasing attendance.
The strong showing at SeaWorld (a 7.8% reported increase in attendance over last year) still shows a desire to visit some of the most unique offerings they provide.
In short, economic challenges through Q2 have not significantly affected the tourism industry, as people are still returning to these popular summer destinations and tourism remain an important part of the economy in these states. INRIX will continue checking in on how parks are rebounding post-COVID and throughout current economic factors. Visit https://inrix.com/blog/inrix-market-trends/ to learn more about how INRIX can help track revenue.


