


For transportation professionals, understanding corridor performance isn’t just about knowing whether traffic conditions improved or worsened—it’s about understanding how much they changed, when those changes occurred, and why. Whether you’re evaluating the results of a signal retiming effort, examining the effects of a construction project, or simply trying to understand how traffic patterns shift during different seasons, the challenge has always been the same: how to measure the true impact of change.
Historically, doing this required manual analysis, labor-intensive data exports, or expensive consultant-led studies. Even then, comparing two time periods—such as before and after a project—can be cumbersome, disconnected from daily workflows, and prone to inconsistencies.
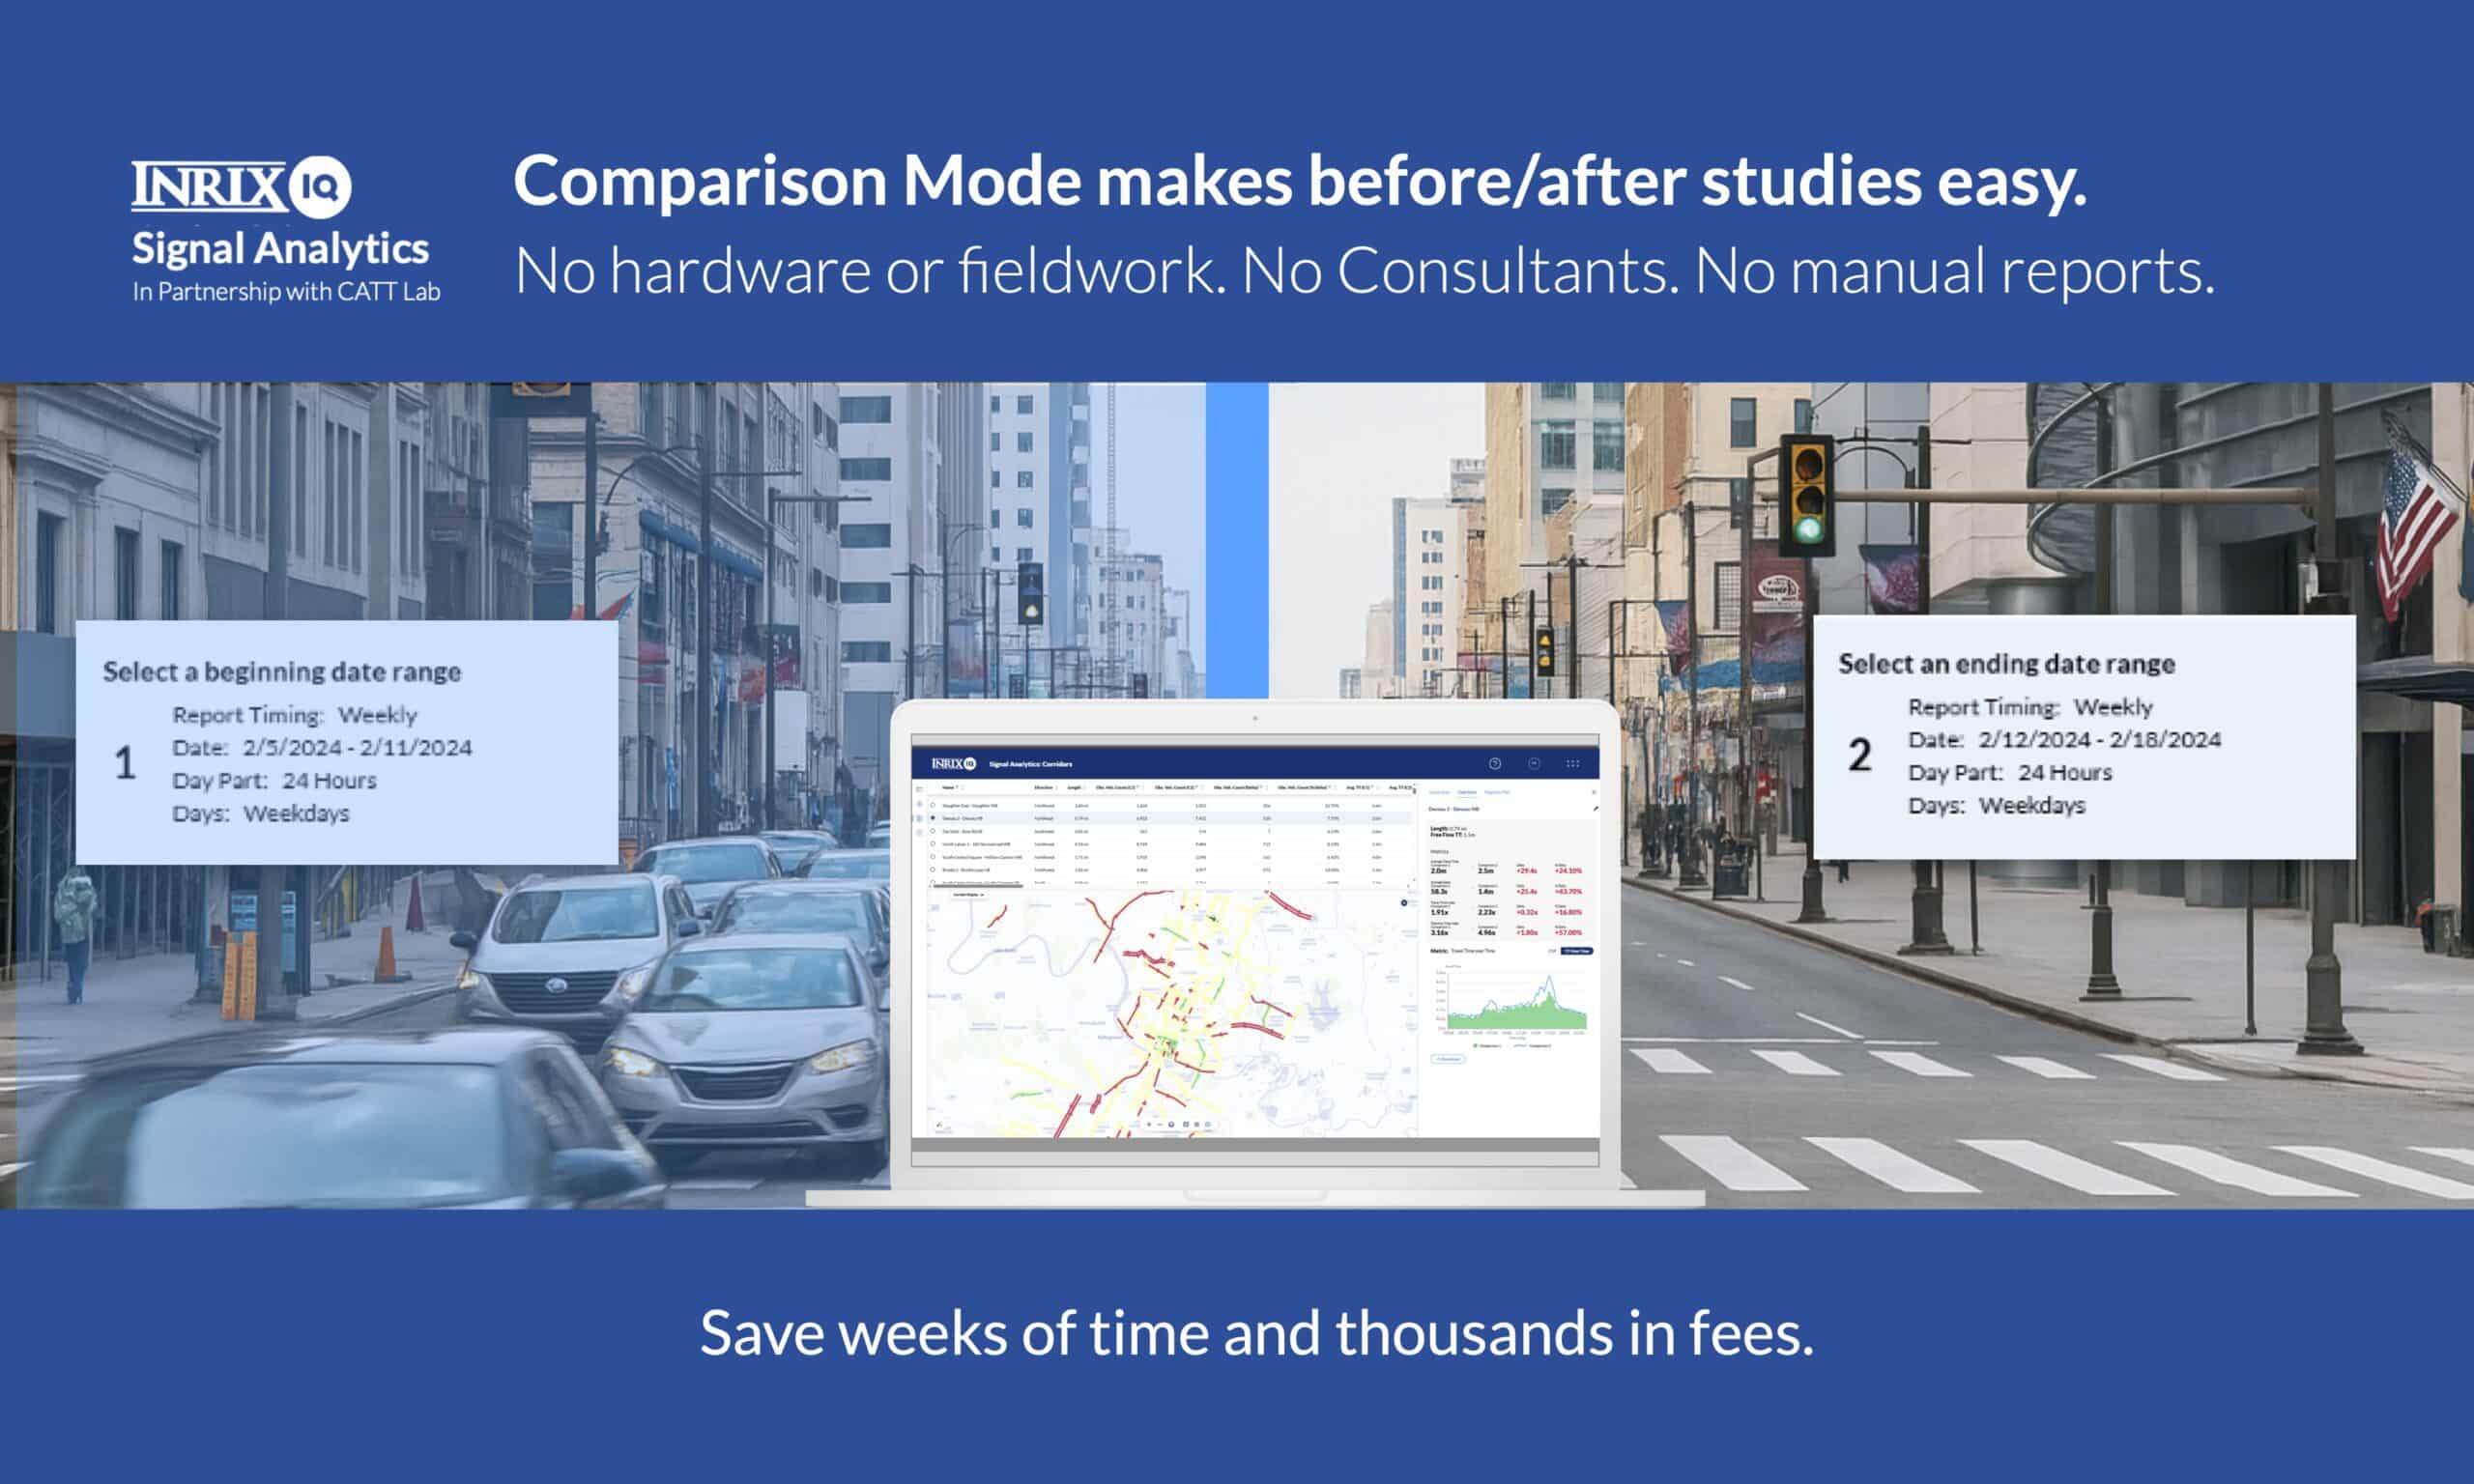
That’s why INRIX just launched a new feature called Comparison Mode for INRIX Signal Analytics. This new feature empowers users to directly compare corridor and signal performance metrics between any two time periods, providing fast, flexible insight into how conditions have changed. No new tools to learn. No additional data processing. Just faster answers from the tools you’re already using.
Comparison Mode gives agencies a fast, cost-effective alternative to traditional before/after studies to assess performance over time—no sensors, fieldwork, or consultants required.
A Flexible Way to Compare Performance Over Time
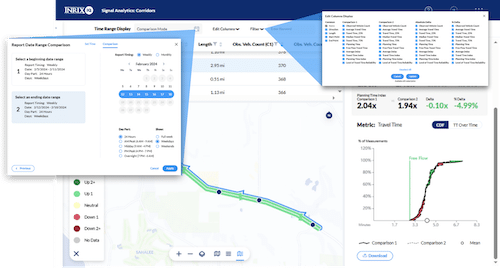
With Comparison Mode users can select two reports—covering any timeframes—and compare corridor-level performance across familiar metrics and visuals. Whether you want to compare one day to another, or a week to a month, the feature gives you full flexibility.
You can view performance changes via:
- Split View Table – Includes side-by-side comparisons of selected metrics (e.g. travel time, delay, LOTTR), showing the observed values, absolute delta, and percentage delta. You can sort and filter based on increases or decreases.
- Map View – A powerful visual tool showing which corridors or signalized intersections improved (green) or worsened (red), allowing for a quick scan across networks to prioritize response.
And because it’s integrated into the core Signal Analytics platform, all reports and metrics can be downloaded to streamline stakeholder reporting, documentation, and data archiving.
Key Benefits of Before/After Analysis Using Comparison Mode
- Faster, Clearer Insights: Instantly see where traffic conditions improved or degraded without needing to export and compare data manually.
- Visual Communication of Results: Use charts, maps and delta tables to clearly communicate findings to internal teams, consultants, or the public.
- Fully Flexible Timeframes: Compare any two periods—day-to-day, week-to-week, season-to-season, or year-over-year—to understand impacts at any scale.
- Leverages Familiar Tools: Built directly into the Corridor module with no new dashboards to learn.
- Downloadable Data for Reporting: Pull exact data and deltas to support grant applications, board updates, or public transparency.
Make Sense of the Metrics that Matter
Comparison Mode supports a wide range of key performance metrics, helping you draw specific, contextual conclusions. You can compare:
- Observed Vehicle Counts – Gauge demand shifts or event impacts by tracking how many vehicles passed through a corridor during each period.
- Travel Time (Median, 25th, 75th Percentile) – Assess congestion and variability in trip durations.
- Average Delay – Determine if retiming efforts reduced wait times or if construction caused more delay.
- Planning Time & Planning Time Index (PTI) – Understand how much extra time users need to plan to arrive on time.
- Travel Time Index (TTI) – See how far current travel times deviate from free-flow conditions.
- Level of Travel Time Reliability (LOTTR) – Analyze consistency over time, essential for freight and transit planning.
As mentioned before, metrics can be analyzed via absolute delta or percentage delta, and are shown in the Split View Table for quick evaluation and export. This format allows you to sort corridors based on how much they’ve improved or degraded, helping you prioritize efforts.
Real-World Use Cases for Comparison Mode
Transportation agencies across the country need to quantify how performance is evolving over time. Our new Comparison Mode feature makes this easier and more insightful. Common use cases include:
- Signal Retiming Assessment
Demonstrate the effectiveness of signal changes by comparing travel time and delay metrics before and after retiming. - Construction Impact Analysis
Compare corridor metrics from the week before construction to the week after it began to evaluate impact and identify time-of-day disruptions. - Event Impact Evaluation
Understand how corridors were affected during major events by comparing traffic conditions on event days vs. typical days. - School-Year vs. Summer Analysis
Compare travel time reliability between the school year and summer months to inform signal timing adjustments or corridor planning. - Weather-Based Performance Monitoring
Determine how travel time and delay fluctuate during storm weeks vs. dry weeks to improve resiliency planning. - Freight Route Performance Monitoring
Use LOTTR and PTI comparisons to determine if freight corridors have become less reliable due to upstream network changes or seasonal shifts.
Get Started Today- Try it Now!
The Comparison Mode feature is available now for all INRIX Signal Analytics users in the Corridor Module and we’ll be rolling it out in the Intersection Module in the coming months. If you’ve ever had to manually compare screenshots, stitch together reports, or rely on static data snapshots to measure performance—this feature was built for you.
If you’re not yet a customer, reach out to our team for a demo and see how INRIX Signal Analytics can transform your corridor management strategies.
See It in Action – Register for the Webinar
Want to see the Comparison Mode feature in action?
Join our upcoming webinar to get a firsthand look at this new feature and hear from transportation experts about how performance metrics are transforming signal operations and planning.
Unlocking the Power of Traffic Signal Performance Measures
August 7, 2025 | 10:00 AM PT / 1:00 PM ET