In the latest report from INRIX, “Mall Resurgence Proves Brick and Mortar Still Alive Despite Pandemic,” we learned about the difficulties mall owner/operators and tenants faced over the last year and a half. The COVID-19 Pandemic – along with local government’s response to the outbreak – reduced visits to malls by 91% in April 2020.
And while the recovery varied from city to city, we found certain cities stand out from others. For example, by July 2020, Chicago jumped from being -95% down from pre-COVID levels to just -19%. Ultimately, Chicago ended June 2021 up 18% from pre-COVID levels, the largest recovery studied.
Chicago |
Los Angeles |
 |
 |
Though making progress, some cities didn’t fare as well. Los Angeles took much longer to recover and still remains -8% below pre-COVID level. In short, malls in cities that reopened earlier in 2020 had higher visits by mid-2021 versus malls where restrictions remained until the fall of 2020.
Read more about our findings, here.
Location Analytics isn’t just for big-box retailers – you can measure any location in the United States.
As the Coronavirus pandemic struck, the United States went into lockdown in March 2020. Businesses closed and employees (where available) were sent to work from home. Though many businesses struggled a few began to thrive, one of those being bike shops.
With gyms closed, and people working from home day after day, many turned to biking for some fresh air and exercise. Retail sales data from the NPD Group showed that in March 2020, children’s leisure bikes saw a double-digit sales increase, while adult leisure bikes saw triple digits. Indoor biking equipment has even grown in popularity, with sales rising by 268% according to the NPD group retail sales data. Demand for bikes is so high that factories cannot keep up, contributing to bike shortages. Due to COVID occupancy and social distancing restrictions, people have been lining up outside of these shops for the opportunity to purchase a bike.
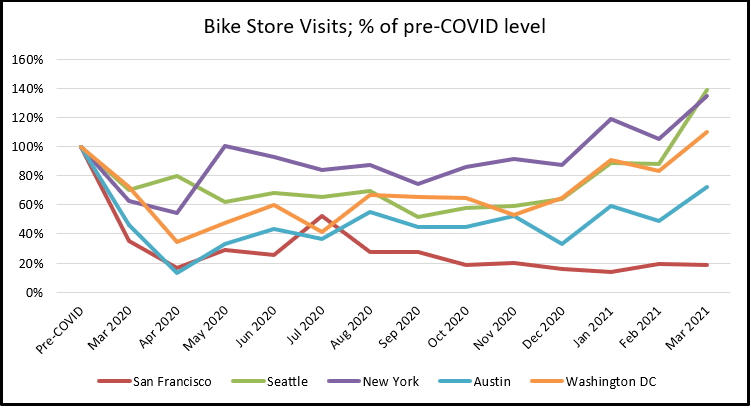
Using INRIX Location Analytics, we look at five of the most popular bike shops in five cities around the country: San Francisco, Seattle, Austin, New York, and Washington DC. This tool allowed us to view the number of visits to selected bike shops every month from January 2020 to July 2021 to see how the visits have changed throughout COVID.

Naturally, at the beginning of the pandemic, trips to bicycle shops dropped. In many areas, like San Francisco, this is in-part due to bicycle shops being initially labeled “non-essential” stores before many states reversed their decision.
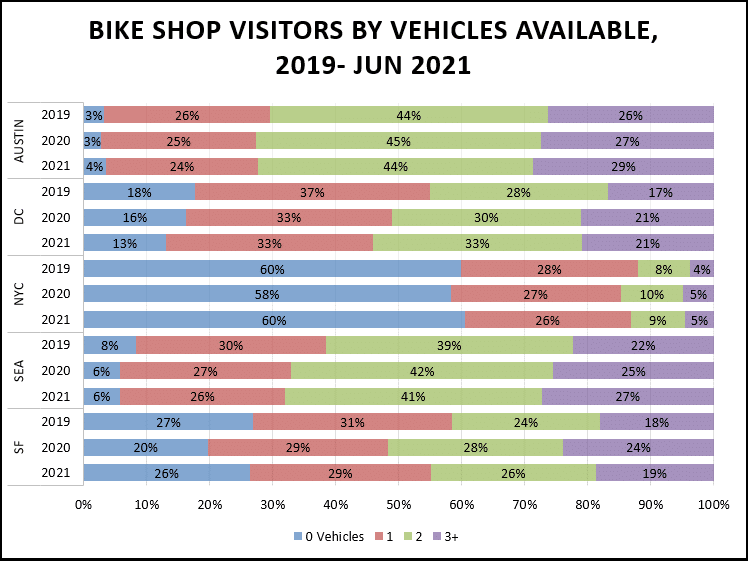
In four of the five cities, trips to bicycle shops continued to increase through March 2021, especially in New York, Seattle, and Washington DC. However, trips to bicycle shops continued to lag in cities like Austin. San Francisco, on the other hand, continues to see significantly fewer visits than pre-COVID. It’s likely that the outsized impact of the pandemic on San Francisco may play a large part. Customer demographics are also important. Using Census data, we can analyze the typical visitor to bike shops to see if consumer demand for cycling has changed during the pandemic.

New York stands out as one location where the majority of cycling shoppers do not own a vehicle. Despite the rise in cycling in New York, the demographics of shoppers didn’t change much, though households that own 2 or more vehicles became a larger share of visitors throughout 2020 & 2021.
The largest change in demographics occurred in San Francisco. In 2020, people who own 2 or vehicles who visited cycling shops increased dramatically, moving from 42% of visitors in 2019 to 52% in 2020, a 24% increase. Across all cities, people who owned cars became a larger part of bike shop customers than in 2019. The shift is significant as it indicates that bike purchases may be more recreationally-focused versus commuter-focused.
INRIX Location Analytics allows users to analyze any storefront, transit hub, or gathering place, to better understand consumer and visitor behavior shifts during the re-emergence from COVID-19 and beyond.


