


This is part of an ongoing series about the causes of traffic congestion and what can be done about it
Last week, we explored the leading causes of traffic congestion and its seasonal and spatial variability using UMD’s CATTLab analysis. Here’s a quick recap if you missed my post:
- Recurring, peak-period congestion is the top cause of congestion nationwide, responsible for nearly one-third of traffic delays. Multiple causes ranks second at nearly one-quarter of delays, while signals cause about 19% of total delay.
- Recurring congestion is the top cause of congestion in 14 states. In 16 states, traffic delays are mostly caused by multiple factors, like incidents and weather, and work zones and incidents.
- Traffic signals are the top cause of congestion in 10 states.
- May is the most congested month across the country, yet in a plurality of states, 21, March is the most congested month.
- With COVID restrictions easing and employers re-opening the workplace, we can expect more traffic congestion on the road network. Specific strategies to reduce the impact of increasing traffic volumes will vary by location, density, and other factors.
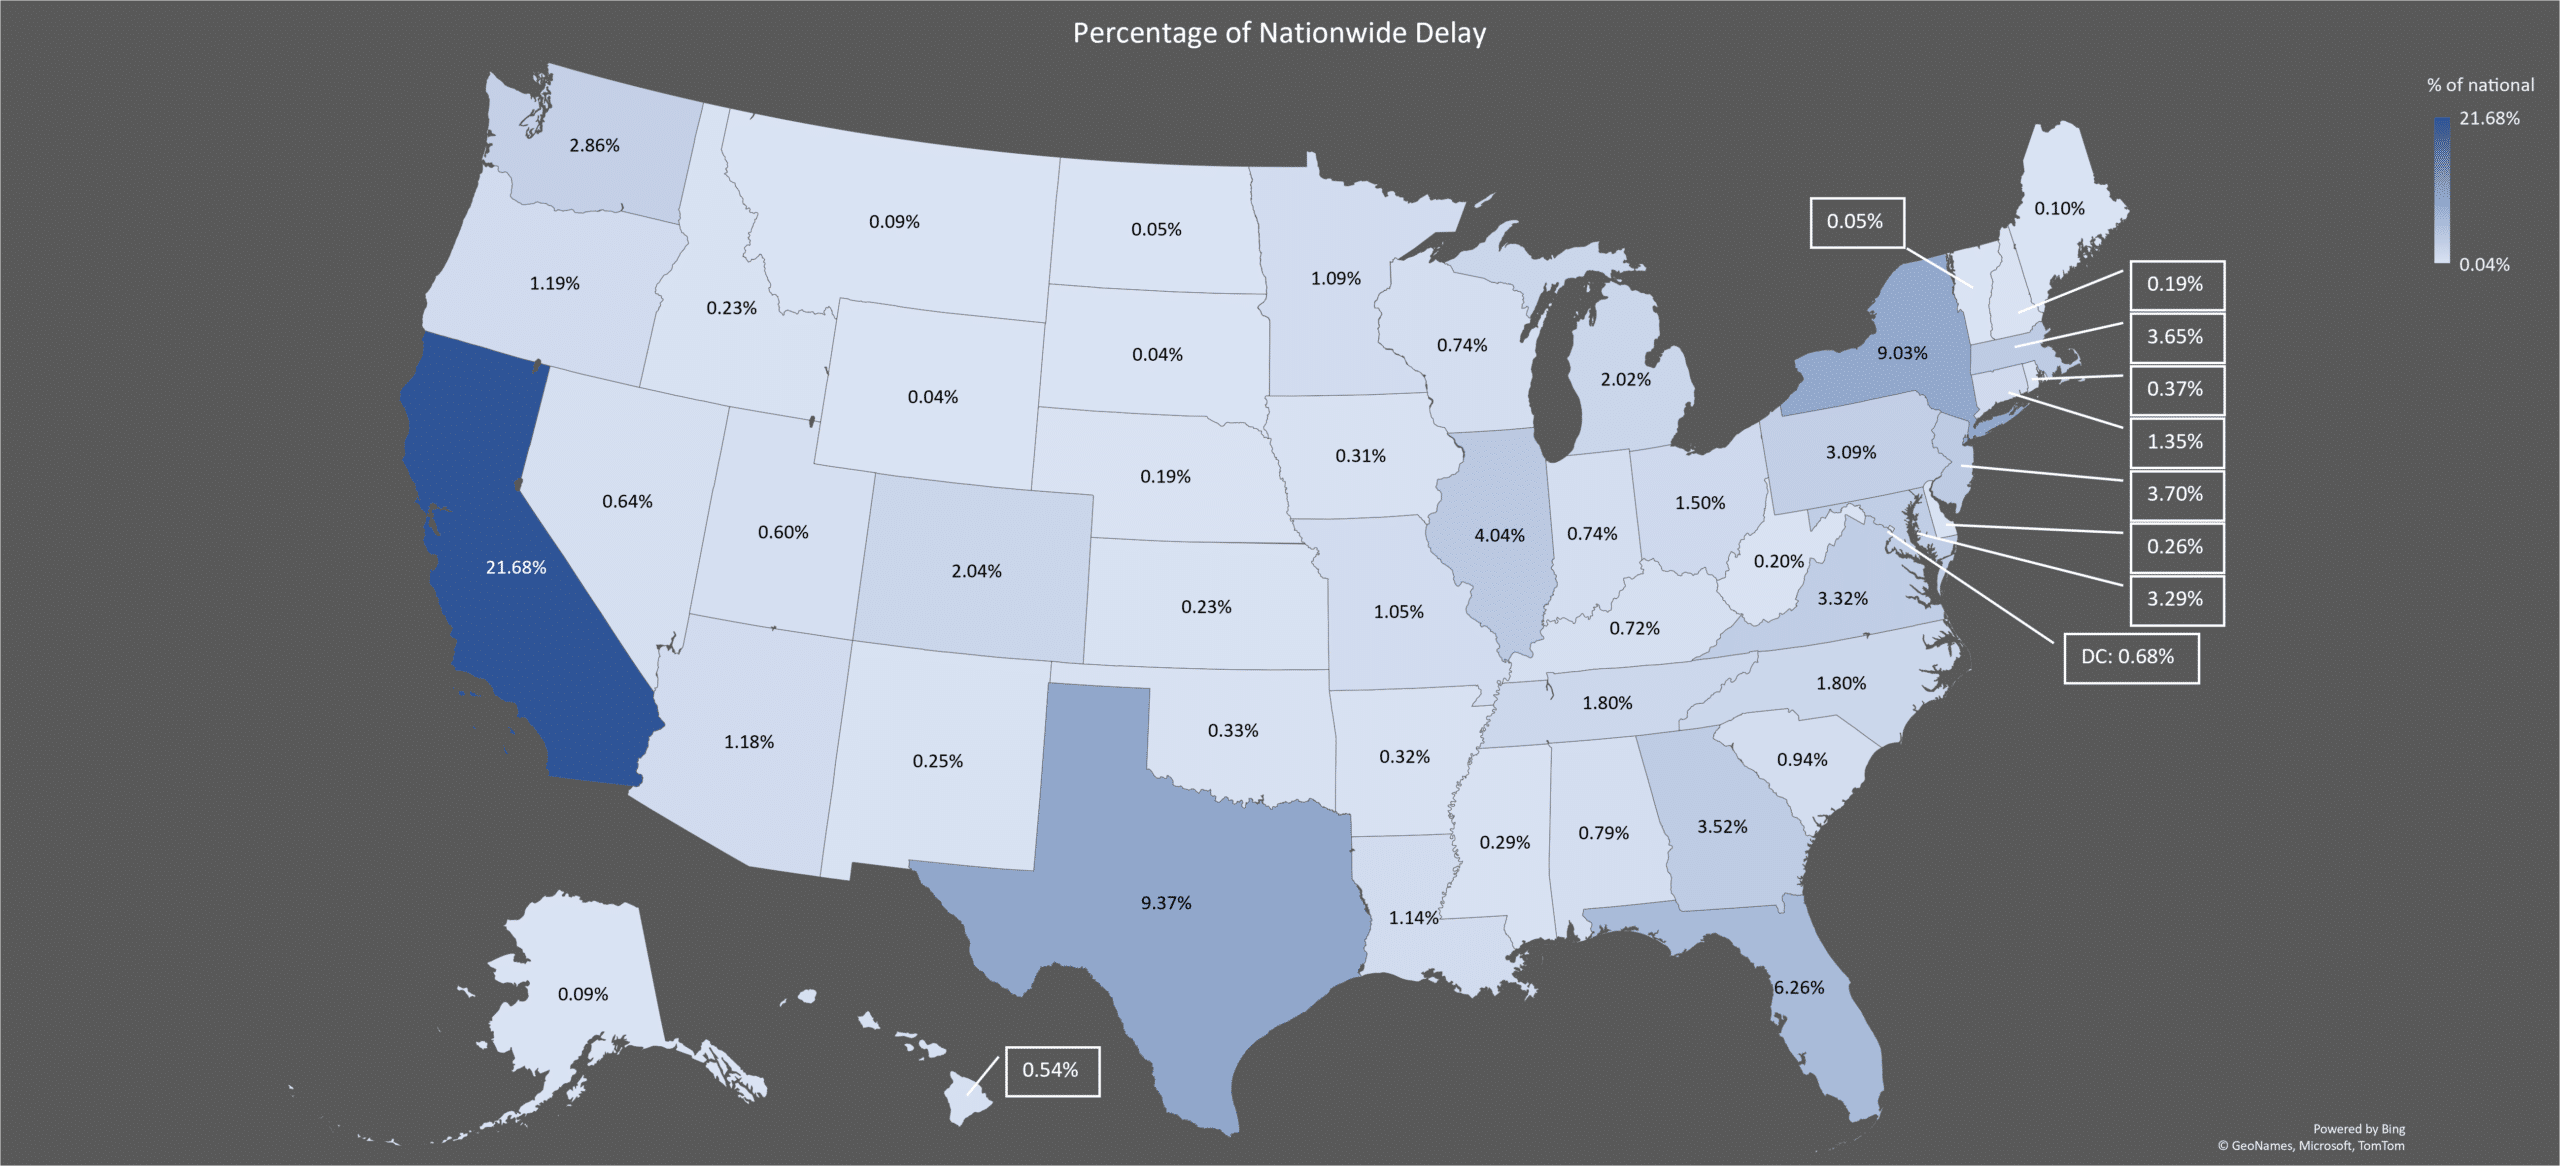
Congestion at the State Level
Traffic delays vary by state, with California accounting for 21.68% of nationwide delay, at 380 million hours of delay. Texas is second, with 9.4% of delay, and New York state takes third with 9.03%. The least congested states are in the Midwest, with South Dakota and Wyoming each responsible for 0.04% of nationwide delay.
Congestion at the Local Level
Traffic congestion is most-present in dense, urban metropolitan areas and counties. In 2019, UMD’s CATTLab reveals the New York Metropolitan Area had the most delay out of any U.S. Metro. Combined, the top 10 metro areas account for 46% of delay in the U.S. but they only comprise of 26% of the country’s population.
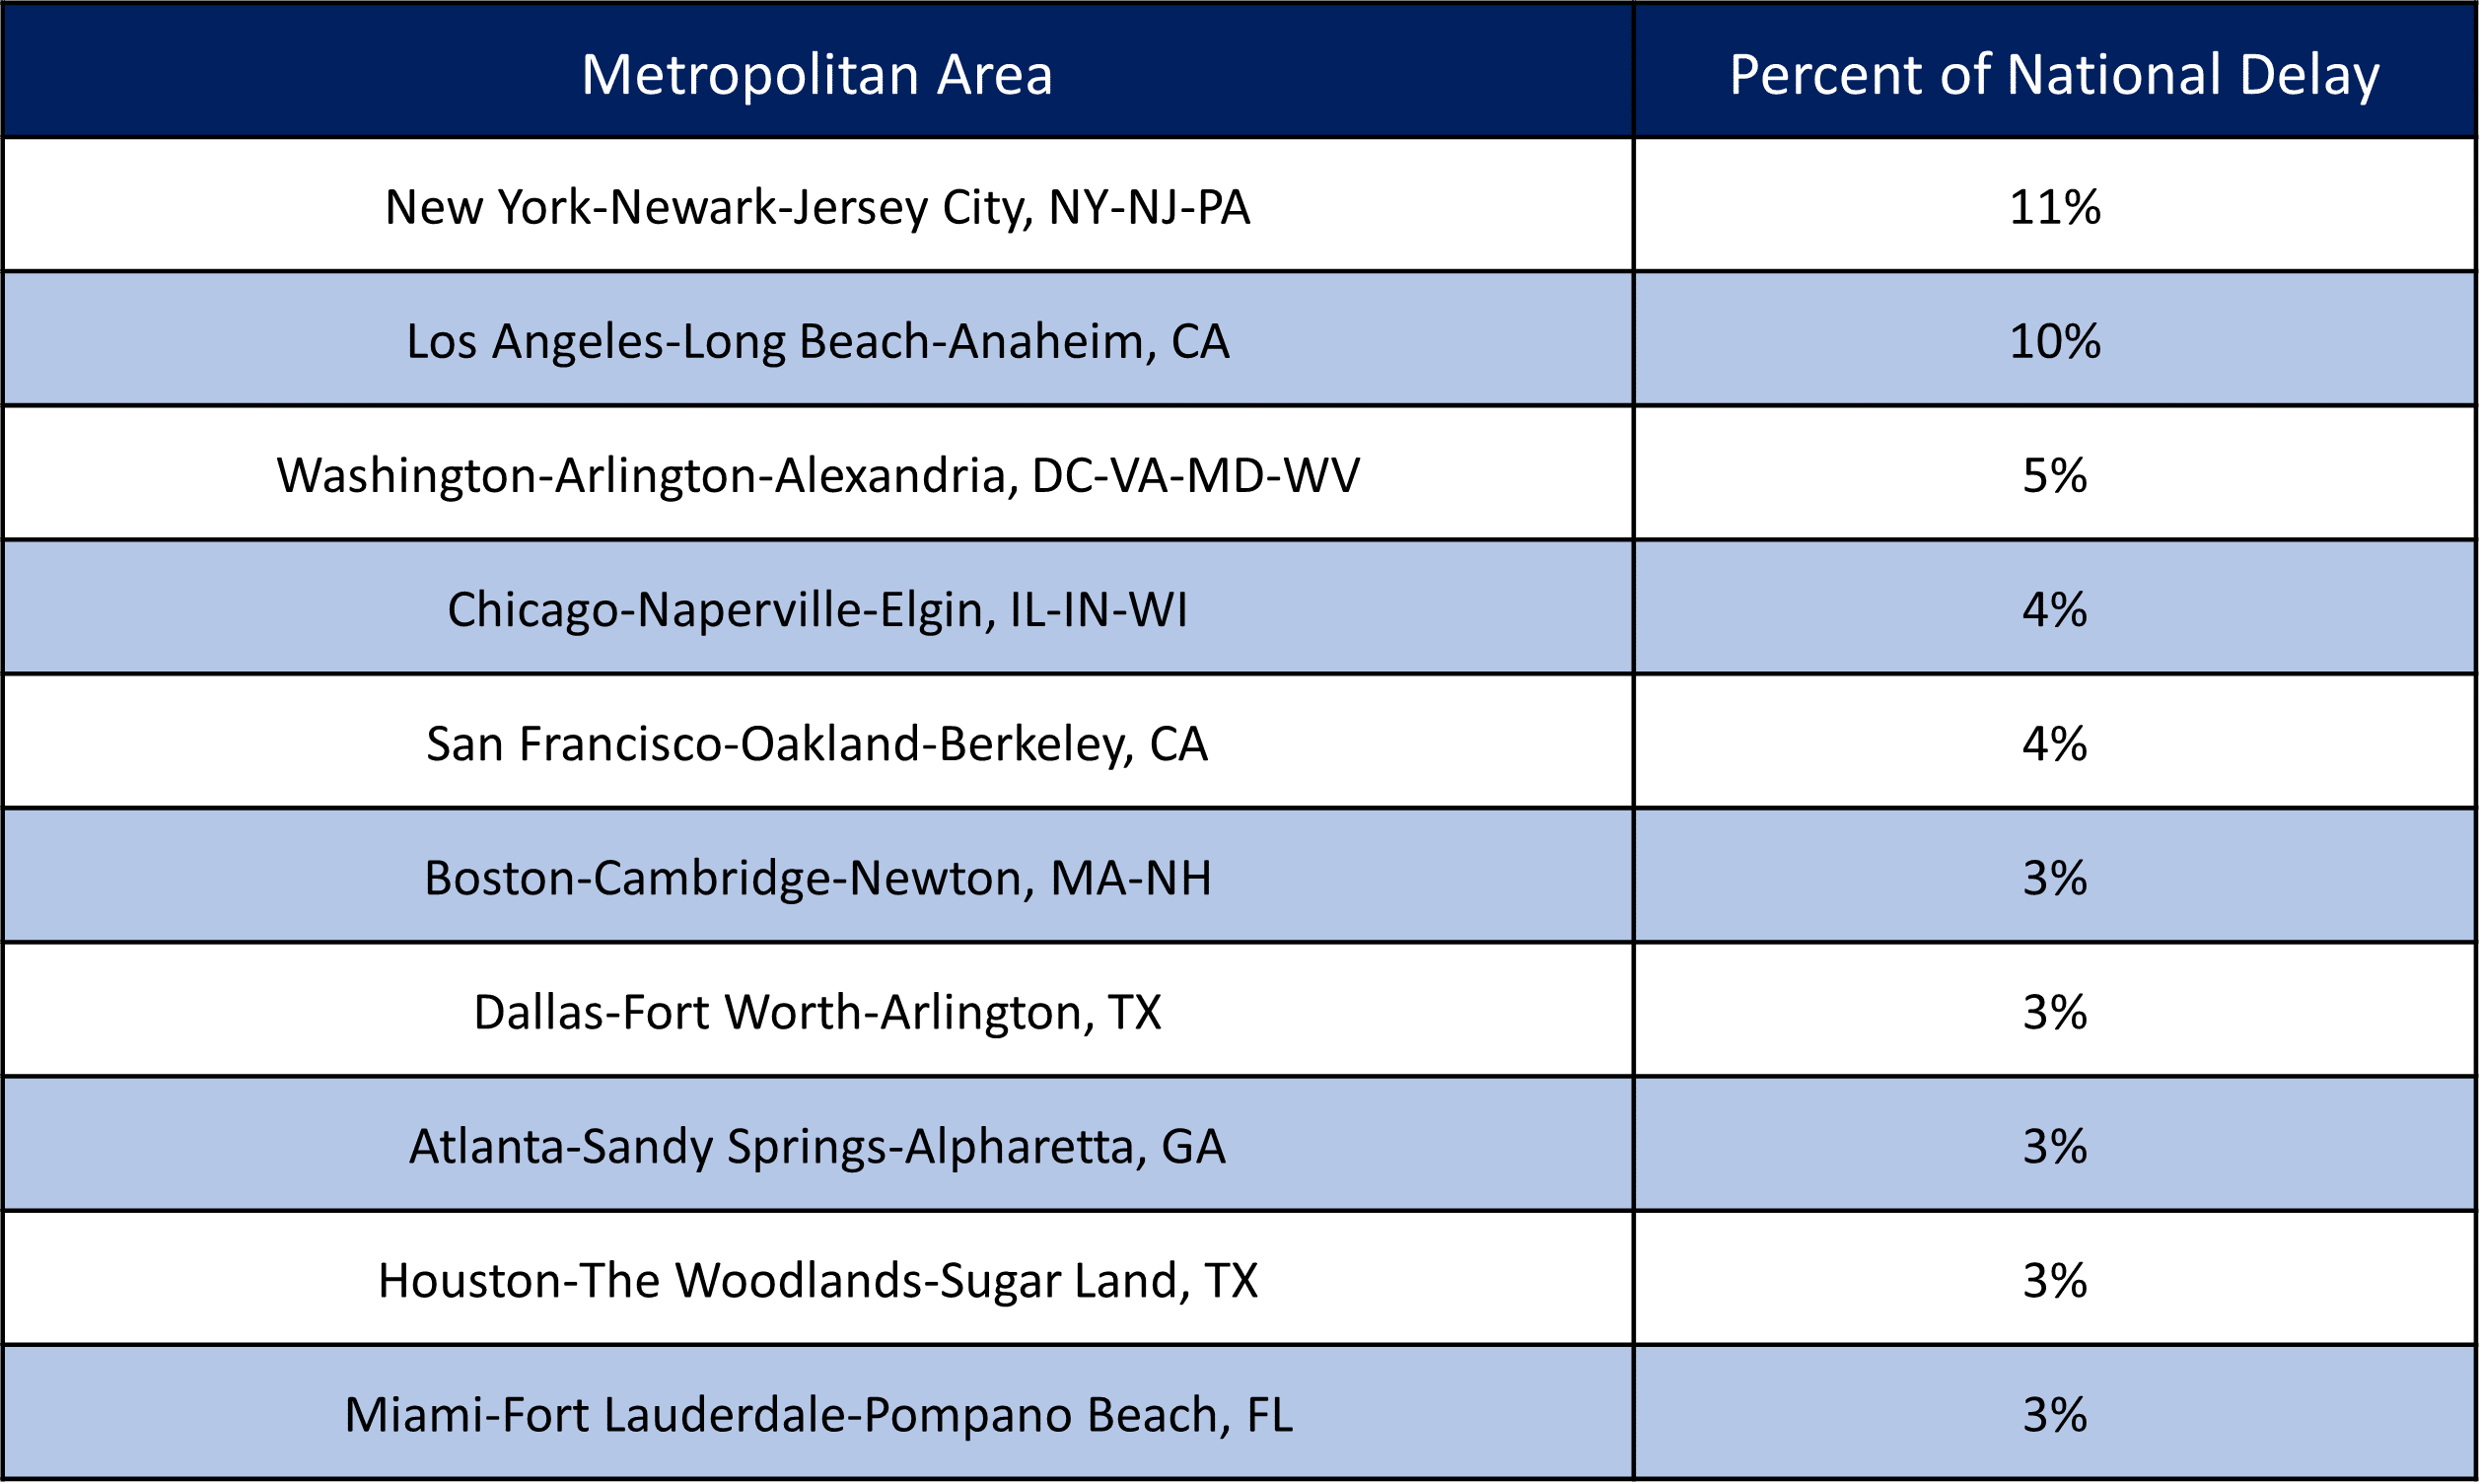
It’s not surprising that the most populated metro areas, New York and Los Angeles by far, have the most delay. However, when adjusting for population size, we significant travel habit differences across the top 10 metro areas. For example, the New York Metro Area’s population of 20.1 million people is 53% larger than Los Angeles’ 13.2 million, yet only experiences 11% more delay. Another example is the Houston metro area, with 50% more people than San Francisco has 20% fewer hours of delay.
In other words, total hours of delay need context. In the New York Metropolitan Area, about 32% of commuters use public transit to get to work, versus about five percent in the Los Angeles area. Many of those on public transit, like rail passengers, avoid traffic congestion entirely. Also, the New York Metro area has about 32% more lane miles of freeway compared to the Los Angeles Metro area. San Francisco is also another area that relies heavily on transit and alternative modes of transportation in dense areas, dedicating fewer roads exclusively to vehicular travel to boost transit, walking and cycling to reduce greenhouse gas emissions.
Causes of Congestion at the Local Level
Part 1 of this series on congestion talked about the differing causes of congestion, with recurring, multiple causes, and traffic signals as the top 3. Naturally, depending on geography, traffic patterns, commuting habits, road capacity, transit utilization, population density, and the local economy, these causes of congestion can vary from metro to metro.
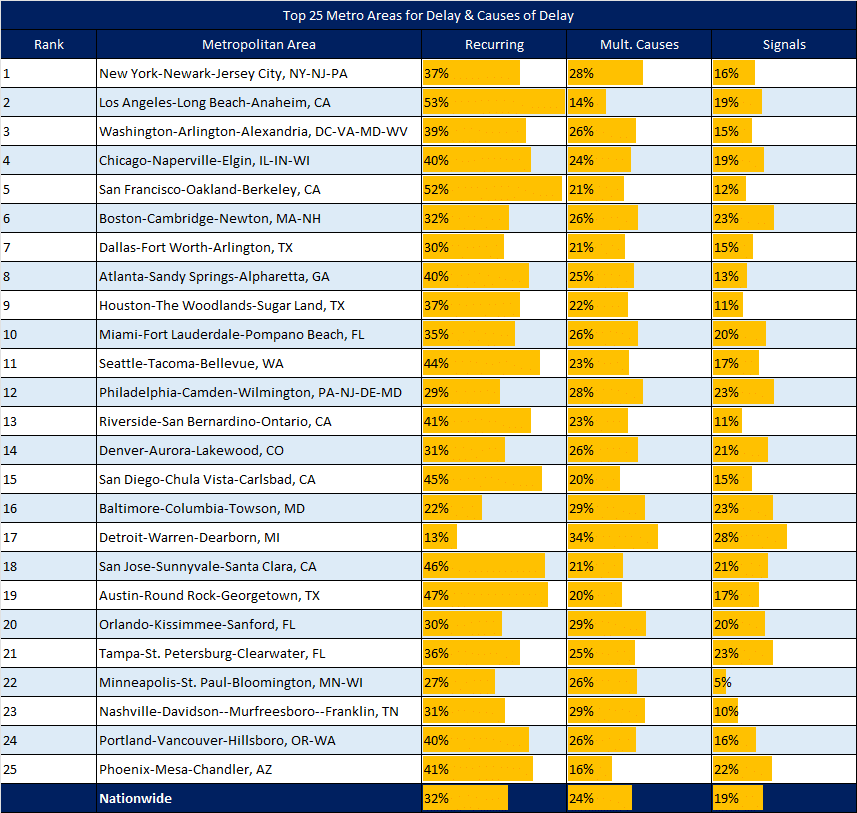
Within the Top 25 Metro Areas identified, the Los Angeles and San Francisco areas stand out in regards to recurring congestion – each with more than half of area congestion being a “predictable and regular pattern of interruption.” Alternatively, the Detroit and Baltimore Metro areas have relatively low levels of recurring congestion, at 13% and 22% respectively.
Traffic signals account for nearly 19% of national delay, yet only cause 5% of delay in the Minneapolis Area, 10% in Nashville Metro, and 11% in Riverside Metro.
In future parts of this series, we will dig deeper into each cause of congestion at the local level, examining what city and metro area officials can do to reduce negative impacts delay has on commuters and travelers, the movement of goods and the environment.