


This is part of an ongoing series about the causes of traffic congestion and what can be done about it
Traffic congestion can be described as the demand for vehicular road travel exceeding the supply (or availability) of roads. Vehicular travel demand is comprised of many different factors, including population and density, employment access, and use of alternatives (telecommuting, transit, walking, and cycling), accessibility of goods and services, etc. On the supply side, lane miles of road, crashes, weather incidents, planned and unplanned construction, event-related road closures, and traffic signal timing, among other things, influence the amount of road available for use.
Traffic congestion’s negative impact on climate & accessibility
Traffic congestion results in lost time and fuel, excess carbon emissions, delayed freight movement, and restricts people’s access to goods and services. In addition, traffic congestion reduces the potential employee pool for businesses, as many people will seek employment within a 30-minute travel time radius. In fact, we looked at how many workers lived within a thirty-minute drive of downtown Seattle between 2019 and 2020. At the heart of the morning rush hour, the number of workers within 30 minutes increased 58% due to lighter traffic during COVID-19, increasing from 508,000 workers to 803,000.
Congestion also slows public transportation, as buses queue along with personal automobiles, freight trucks and taxi’s/rideshares.
Knowing why congestion builds allows public officials and government agencies to tackle delays strategically and cost-effectively. Solutions that may work for one street, city, county, or state may not work as well in another region – as the traffic congestion causes may differ. Additionally, the cost of relieving congestion may not exceed the benefits, so officials may opt not to reduce congestion in an area, but instead try alternative methods to increase person throughput.
To gain a better understanding of why and where traffic builds, the University of Maryland CATT Lab utilized INRIX data to provide the latest information on the causes of congestion. This work is free for the public to examine and analyze traffic trends affecting their region.
Types of traffic congestion
Traffic congestion is typically categorized as either recurring or non-recurring. Recurring congestion is relatively predictable – the normal morning and evening commute periods – while non-recurring is less predictable, and includes things like traffic crashes, snowstorms and construction or bridge repair. Full definitions and methodologies from UMD’s CATT Lab are available here.
Nationally, recurring congestion is responsible for nearly one-third of traffic delay and is the top cause of congestion in 14 states, including heavily populated states like California, Texas, Florida and New York. Non-recurring congestion represents two-thirds of traffic delay nationwide, and in 37 states (including Washington D.C) non-recurring congestion is the top cause of congestion.
Figure 1
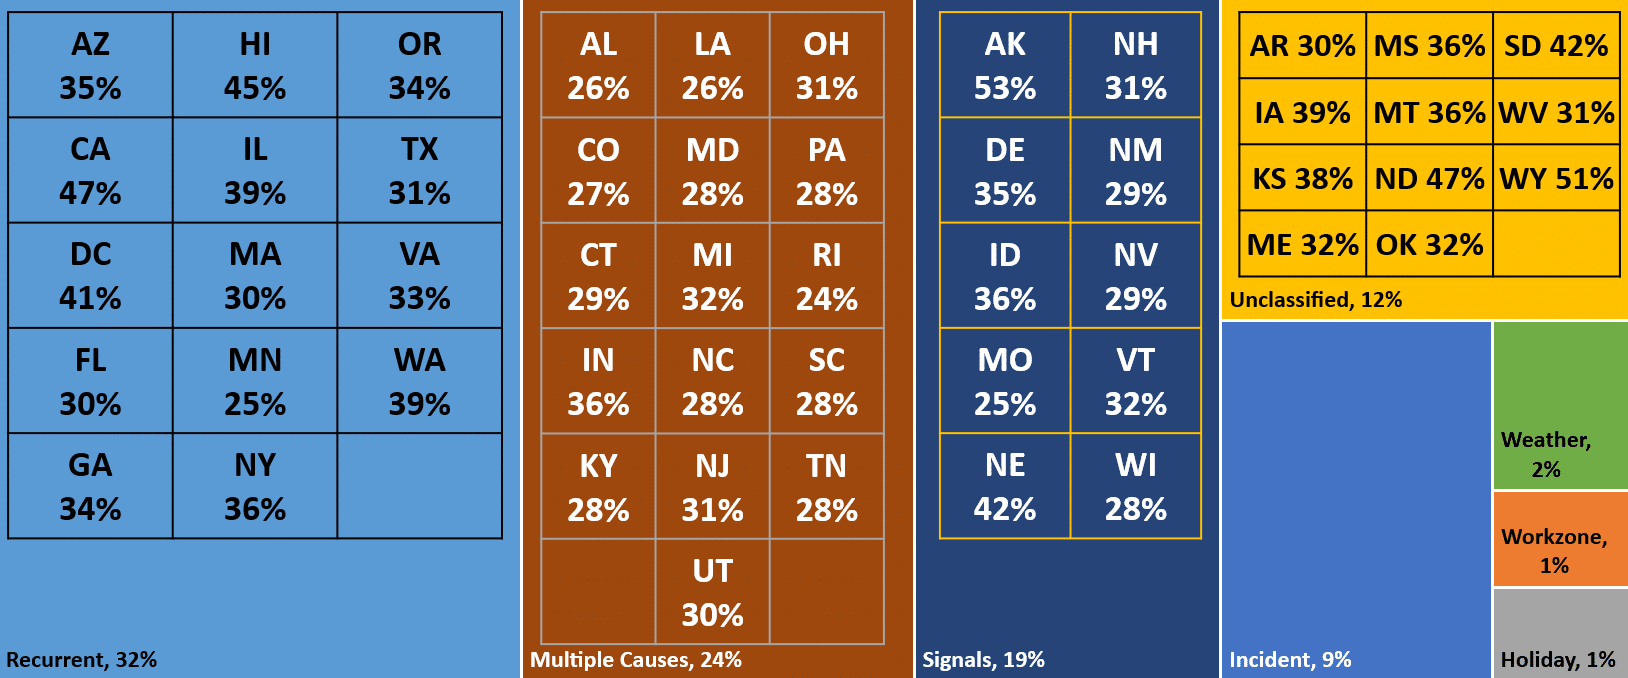
“Multiple Causes” is the second-leading cause of congestion, and the top cause of congestion among 16 states. Multiple causes include combinations of events, like Incidents (crashes, road obstructions) and weather (snowstorms, rain, ice) and Work zones and Incidents.
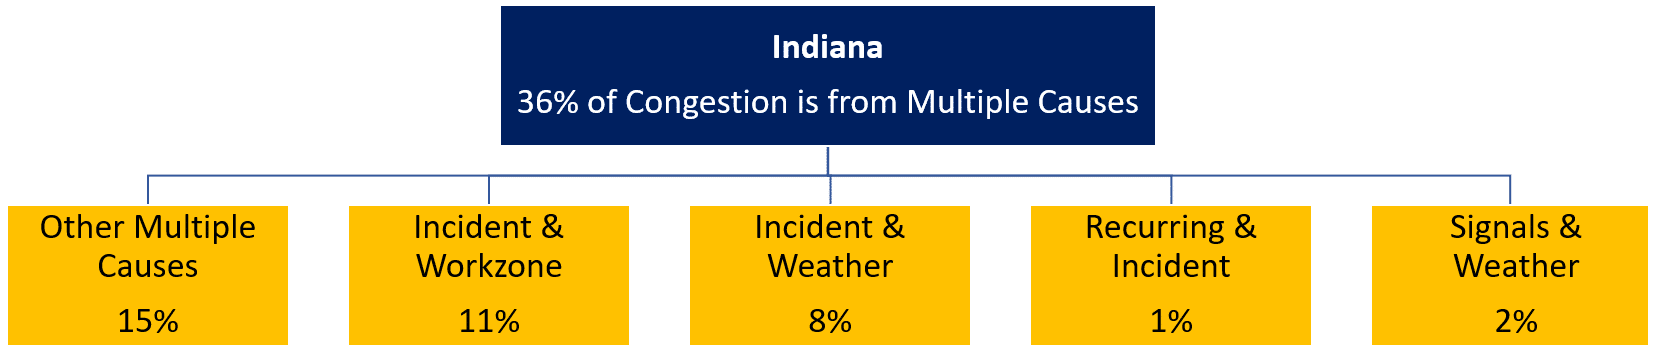
For example, as shown in Figure 2, 36% of traffic congestion in Indiana is due to multiple causes, which can be further broken down by: Other (15%), Incident & Work zone (11%), Incident & Weather (8%), Recurring & Incident (1%), and Signals & Weather (2%).
Figure 2
Traffic signals cause delays as vehicles queue at intersections. In 10 states, traffic signals are the top cause of traffic congestion, though congestion levels overall remain relatively low in those states. For example, even though Alaska ranked highest in the country in percentage of delay caused by Signals at 53%, it ranked 42nd in terms of total hours of delay caused by signals.
Unclassified delay is just that – unclassified. Experts were unable to tie congestion to a specific cause. Lower population and mid-west states tended to have the largest amount of congestion that is caused by unclassified factors – needing more data and analysis to determine precise causes.
Incidents, weather, work zone and holiday delays were still significant factors in congestion nationally, with incidents alone representing 9% of congestion. It should be noted, however, that when included with multiple causes that involve incidents, the impact of incidents increase.
Seasonal and Spatial Variability of Congestion
Traffic congestion varies spatially and seasonally as well. Nationally, May is the most-delayed month with 165 million hours of traffic delay, while January is the least-congested month with 118 million hours.
| Month | U.S. Delay (Hours) | Rank | States |
| January | 118.3M | 12 | 2 |
| February | 126.5M | 11 | 1 |
| March | 154.7M | 3 | 21 |
| April | 154.5M | 4 | 5 |
| May | 165.2M | 1 | 8 |
| June | 151.7M | 6 | 1 |
| July | 144.6M | 8 | 5 |
| August | 153.1M | 5 | 3 |
| September | 146.1M | 7 | 0 |
| October | 160.1M | 2 | 5 |
| November | 143.0M | 9 | 0 |
| December | 134.2M | 10 | 0 |
However, May is only the most-congested month in 8 out of 51 states (Washington D.C. is included as a state). In 21 states, March is the most-congested month of the year.
This stems from heavily-congested states, California (22% of national delay) and New York (9% of national delay), having most of their congestion outside of this time period, and all states registering high (but not the highest) congestion in May.
The return to “normal” will increase traffic on the road network
Throughout the COVID-19 pandemic, state and local restrictions on schools, businesses, gatherings, masks and vaccine mandates varied. For example, shopping malls in Atlanta and Austin reopened to the public in April and May 2020, while malls in Los Angeles and New York City reopened in September and October 2020, six months later. Similarly, New York state also required update vaccine verification to sit down at restaurants and other venues, while states like Florida did not.
Despite the various restriction levels, however, states are relaxing regulations across the nation as California, New York and other states announced an end to statewide mask mandates. King County, WA just announced plans to drop vaccination requirements at restaurants, bars and gyms. Employers are also kick-starting plans to reopen offices. Microsoft, based in Redmond, WA, just announced plans to bring workers back by the end of February.
Drivers and freight movers should expect more traffic congestion over the coming months as a result. Per our 2021 Global Traffic Scorecard, nationwide commuting delays in 2021 were just 36% of pre-COVID levels as a result of weaker-than-normal AM commute volumes and the Delta variant’s impact on travel.
As traffic returns to the nation’s roads it will be important to monitor exactly where, when, and why congestion is building in order to reduce peak demand on the transportation system. Reducing peak demand on the roadway is one key strategy to reducing greenhouse gas emissions and crashes while keeping people and goods flowing as people return to the workplace and economies begin their transition out of the COVID-19 pandemic.
Future blogs in this series will explore traffic congestion more in-depth – at the metropolitan & county areas – digging deeper into specific congestion-causing activities. Stay tuned for more on this topic from INRIX Research.