Even before COVID-19, telecommuting was on the rise. In 2019 about 5.9% of workers nationwide reported working from home, a growing trend stretching over a decade. Yet by 2021, working from home ballooned to nearly 18% of workers, according to the US Census Bureau. In many states and metropolitan areas across the United States the jump was even higher.
Freshly released data from the Census Bureau found the share of workers telecommuting fell from 17.8% of workers in 2021 to 15.2% in 2022, due to both fewer telecommuters and higher employment. Here are some quick takeaways from the latest data release:
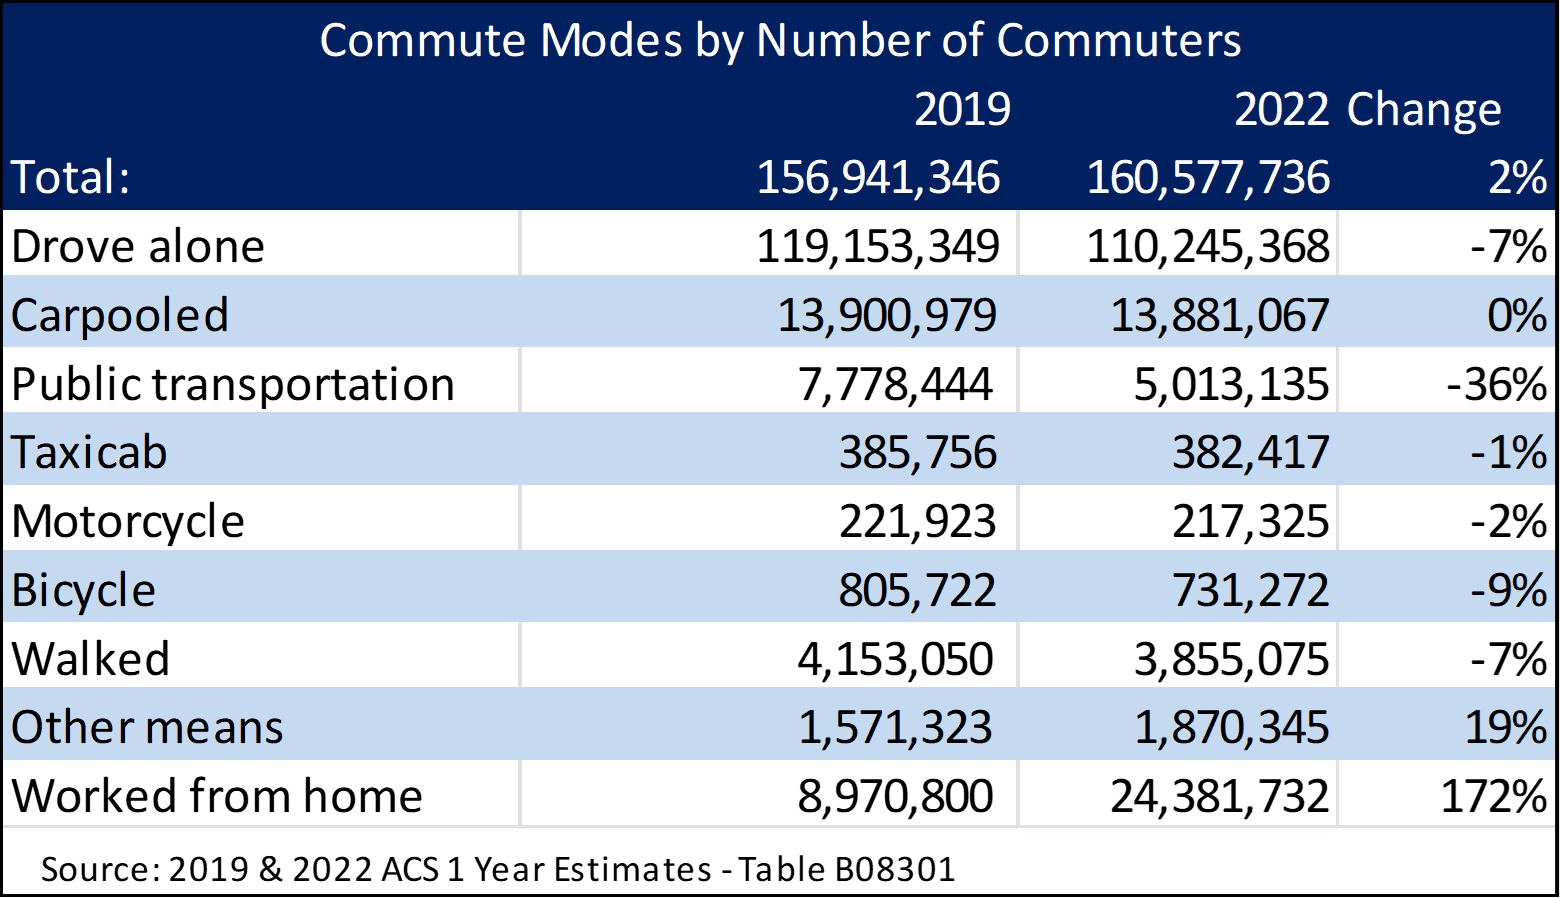
- 3.2 million fewer people worked from home.
- 6.2 million more people commuted on all modes last year;
- 7.5 million more people drove or carpooled to work;
- 1.2 million more people took public transit to work;
- 460 thousand more people walked to work;
- 115 thousand more people cycled to work;
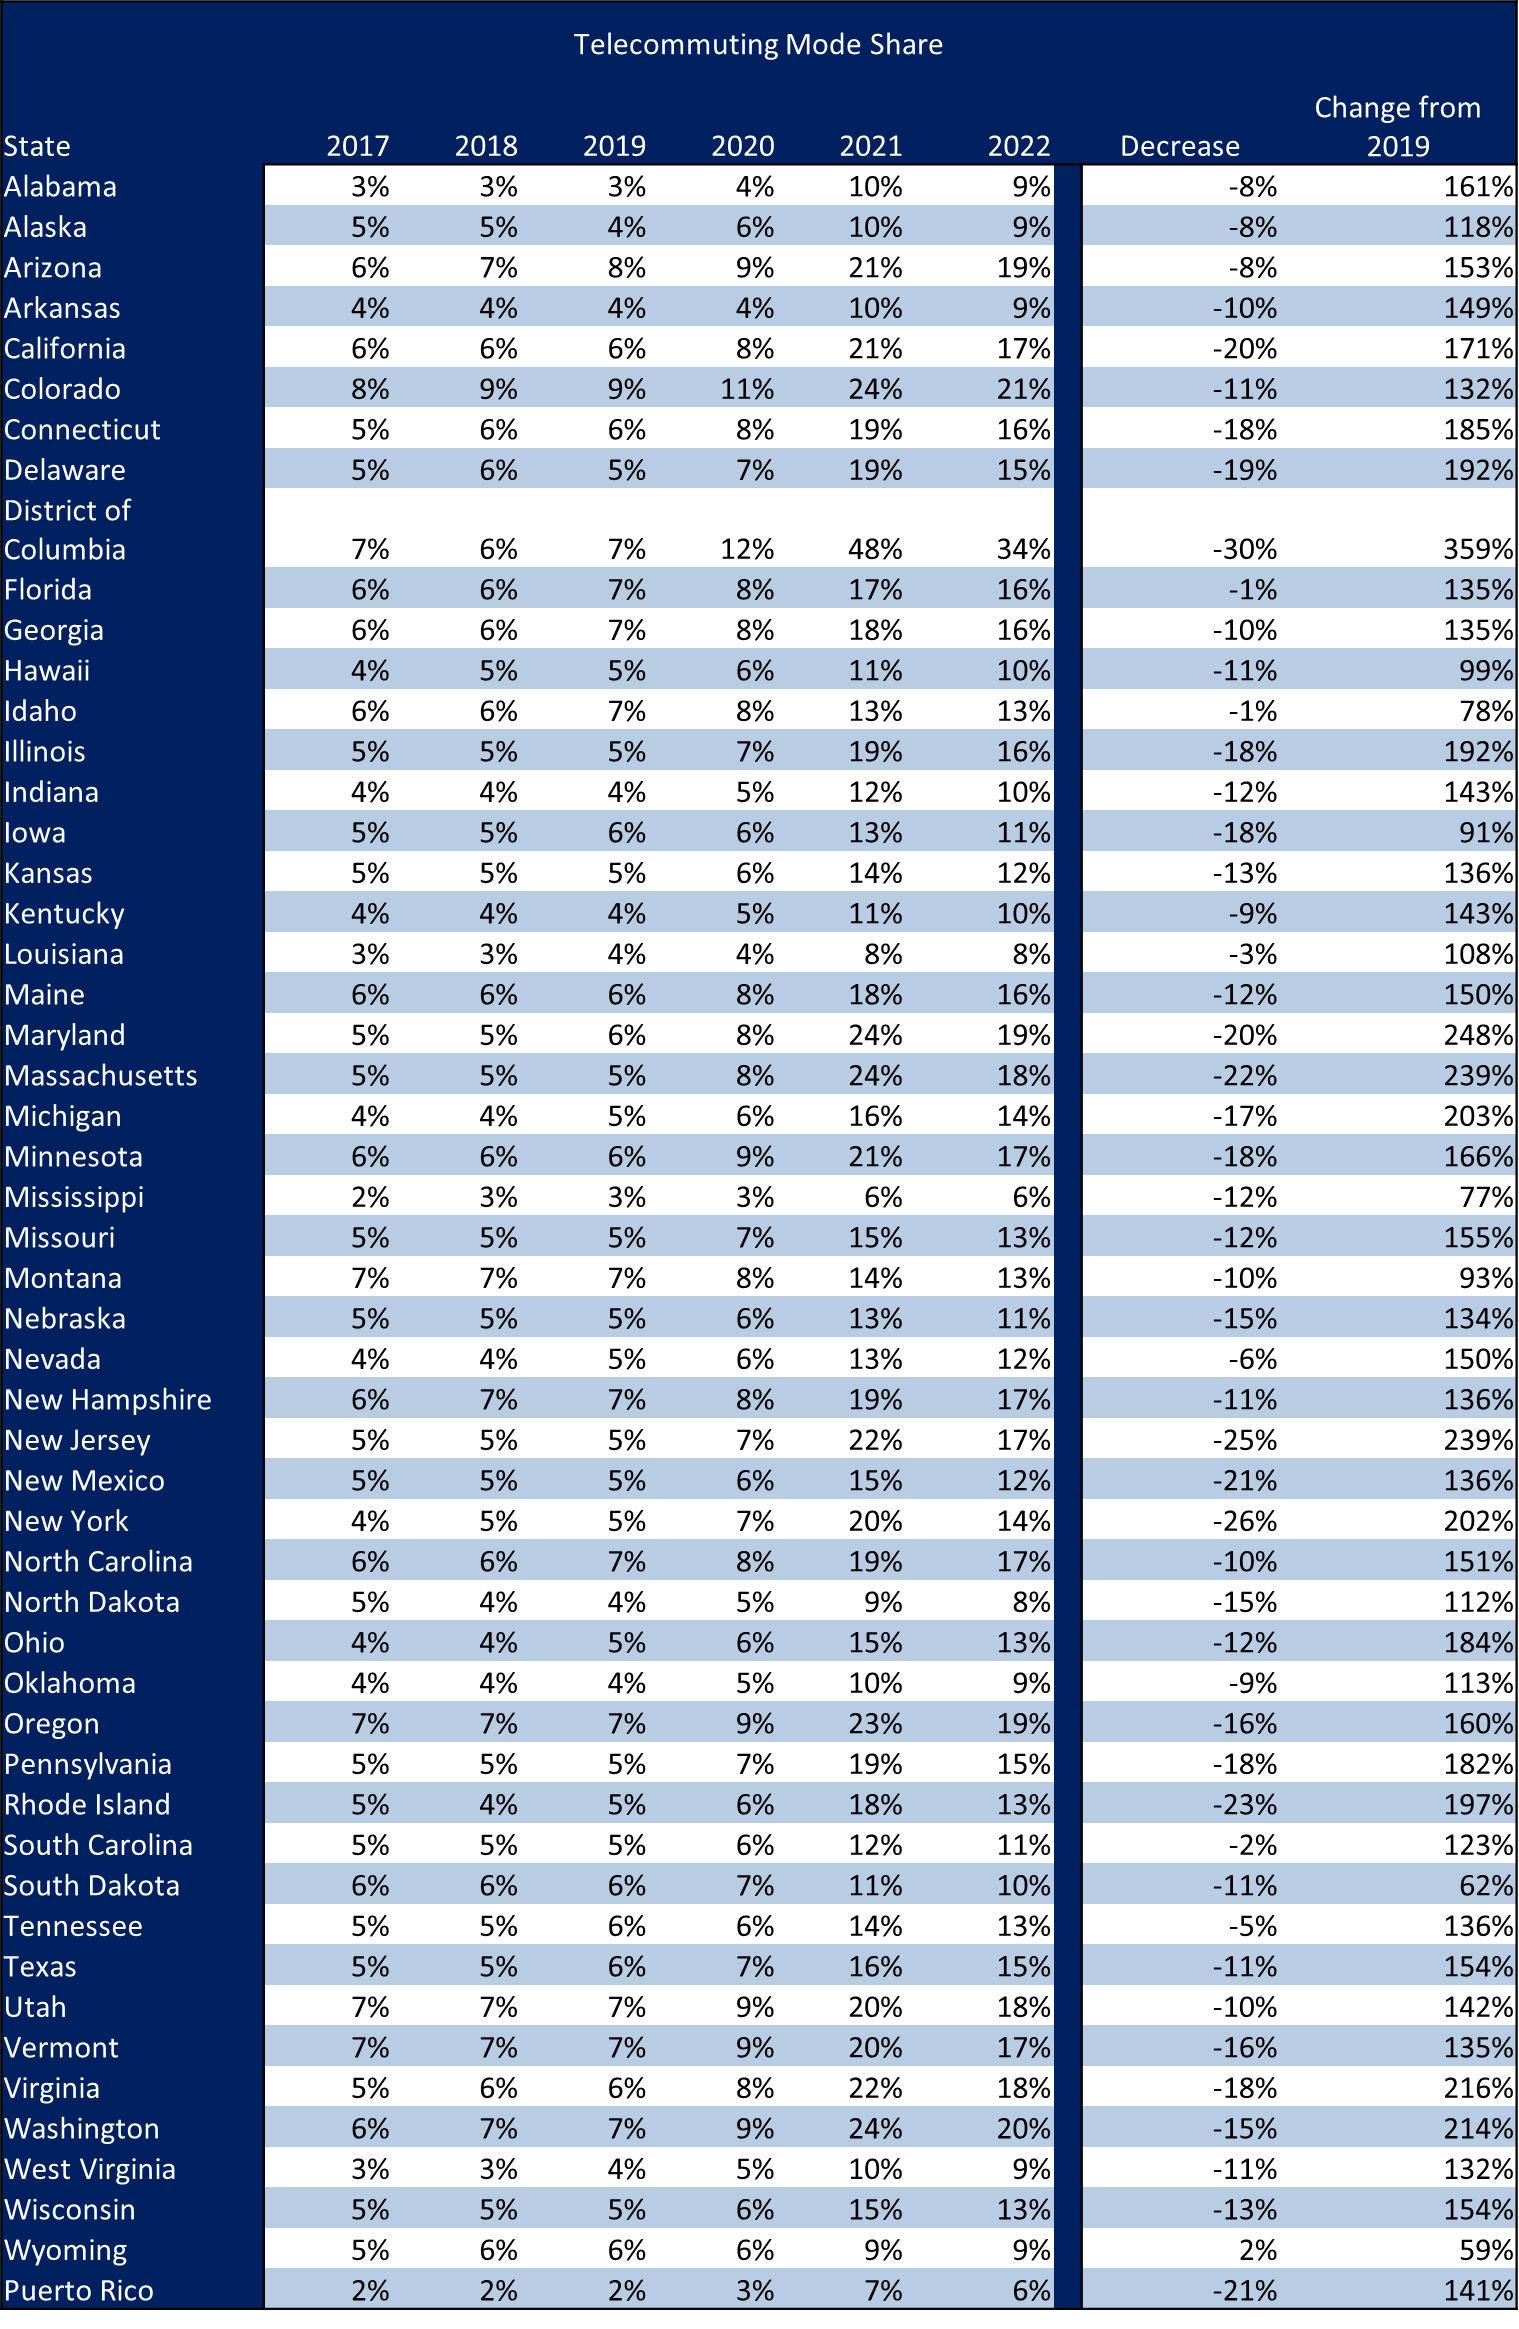
Yet the trends in telecommuting differed significantly by state as evidenced by the map below (full table at bottom):

Telecommuting’s share of commuting dropped in 49 states and D.C., while it grew 2% in Wyoming. Excluding Washington D.C., telecommuting dropped the most in New York state (-26%) and in New Jersey (-25%). While a closer look at the New York Metro area is warranted, the results coincide with the recent INRIX Return to Office report, which showed vehicle trips to Downtown Manhattan down just -4% from pre-COVID levels by May 2023.
Notably, the drop was generally larger in the Northeast Region and Western States, likely due to those places having the largest increases in telecommuting during the COVID pandemic.
Telecommuting still going strong, but likely to continue to decline in 2023
However, even with the drop in telecommuting, all other modes of getting to work nationwide (besides “other”) were still down from their 2019 levels to varying degrees: from a 0% change in carpooling to a -36% difference for public transit. The table follows:

Considering that driving, transit and other modes have increased since last year, the data shows those modes will continue to have moderate growth in 2023. The INRIX Return to Office report shows most major downtown employment centers gaining vehicle trips halfway into 2023, and traffic delay numbers in major metro regions are on the rise.
In short, the latest data from both the US Census Bureau and INRIX can provide key insights into emerging patterns and reveal a clearer picture into “new normal” traffic and commuting patterns. By using respected data sources like the Census and real-time data and analytics, transportation experts, planners, policymakers the private sector can work together to improve mobility.
INRIX will continue to dive deeper into the data to provide more in-depth analysis as we continue into the Winter.
Change in Telecommuting by State Data Table


