


Data plays a critical role in the development and implementation of Vision Zero Plans. In this blog, we’ll explore the importance of using data to inform decision-making when building a Safety Action Plan. We’ll also discuss the types of data that are commonly used in Vision Zero planning and highlight some best practices for analyzing data to support effective traffic safety interventions.
Traffic fatalities and injuries are a major public health concern, and Vision Zero initiatives seek to eliminate these incidents altogether. However, achieving this goal requires effective Safety Action Plans that prioritize safety initiatives and allocate resources efficiently.
A Data-Driven Approach to Vision Zero Planning is Essential
A data-driven approach to Vision Zero is important because it allows policymakers and traffic safety experts to understand the scope and nature of traffic crashes in a community, identify high-risk areas, and develop evidence-based interventions to address them.
Data can also help to evaluate the effectiveness of safety interventions over time. By tracking changes in crash rates and severity before and after an intervention, policymakers and safety experts can determine whether the intervention was successful and adjust their strategies accordingly.
Data informs road design improvements to address safety issues.
By analyzing a wide variety of data, stakeholders can identify common causes of crashes and prioritize interventions that have the greatest potential to reduce fatalities and serious injuries. For example, data can help identify intersections with a high number of crashes and determine that installing a roundabout or adding pedestrian crossings can improve safety.
More effective use of resources by prioritizing safety initiatives based on data.
An analytics approach can also help transportation agencies prioritize and budget steps toward Vision Zero goals, as simply decreasing speed limits are often ineffective without enforcement. With the right data and tools, city officials can justify alternative traffic calming measures such as speed bumps, roundabouts, and medians.
Ultimately, a data-driven approach can help communities achieve the goal of Vision Zero. By using data to understand the root causes of crashes and prioritize evidence-based interventions, communities can make real progress toward eliminating traffic fatalities and serious injuries.
A data-driven approach is critical for Vision Zero planning because it helps:
- Identify high-risk areas: Safety data can help identify areas where crashes, fatalities, and severe injuries occur frequently. By analyzing diverse data types, transportation agencies can pinpoint high-risk areas and prioritize interventions accordingly.
- Prioritize interventions: Safety data can help prioritize interventions based on their potential to reduce crashes and improve safety. Transportation agencies can use data to determine which interventions will be the most effective in reducing fatalities and severe injuries.
- Evaluate the effectiveness of interventions: Data can be used to evaluate the effectiveness of safety interventions. By comparing crash data before and after an intervention, transportation agencies can determine whether the intervention was successful in reducing crashes and improving safety.
- Engage stakeholders: Safety data can be used to engage stakeholders in the Vision Zero planning process. By sharing safety data with community members, transportation agencies can increase public awareness about the need for safety improvements and build support for safety initiatives.
- Measure progress: Safety data can be used to measure progress towards Vision Zero goals. By tracking changes in crash data over time, transportation agencies can assess the effectiveness of safety interventions and make adjustments as needed.
The Importance of Fresh, Accurate, and Comprehensive Road Safety Data
Developing a comprehensive Safety Action Plan requires a deep understanding of road safety data. Without accurate, comprehensive, and up-to-date data, transportation professionals cannot develop effective interventions that address the underlying causes of road accidents.
Some commonly used types of road safety data that are critical for Safety Action Plan development include:
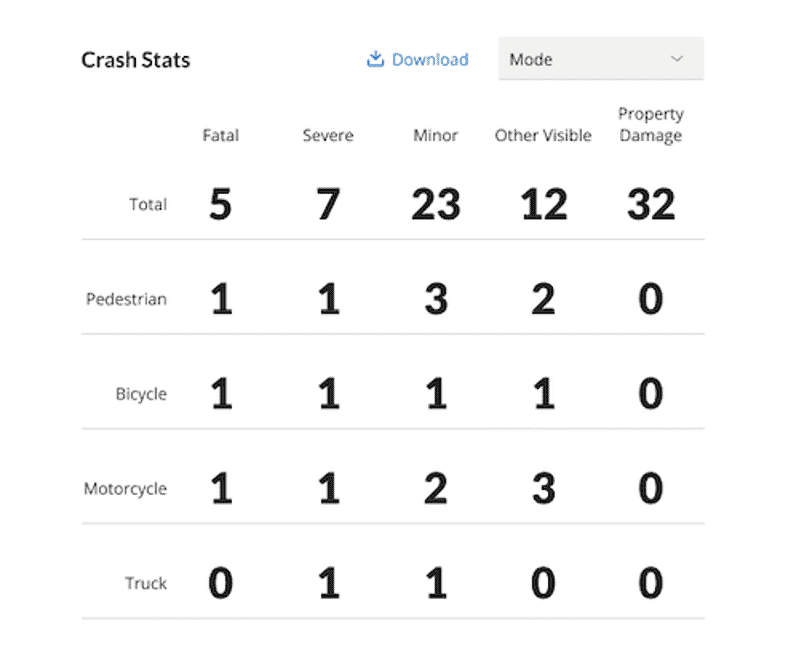
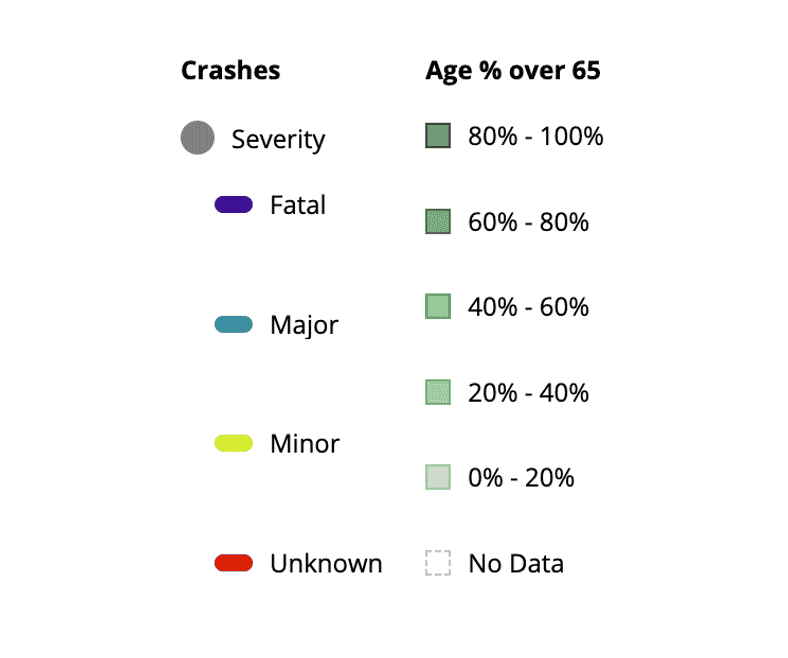
- FARS and Crash Data: The Fatality Analysis Reporting System (FARS) is a database maintained by the National Highway Traffic Safety Administration (NHTSA) that provides detailed information on all fatal crashes that occur on U.S. roads. This data can be particularly useful in identifying trends and patterns in fatal crashes and understanding the factors that contribute to them. Crash data can be used to identify high-risk areas and determine the types of crashes that occur, such as rear-end, angle, or pedestrian-related. This information can help safety stakeholders develop targeted interventions such as improved road design, installation of safety countermeasures, or enforcement strategies.
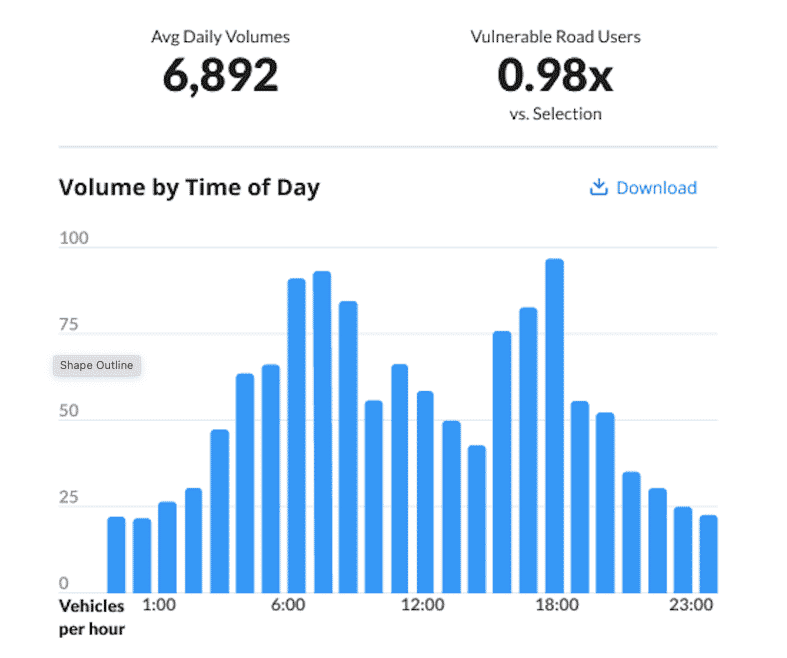
- Traffic Volume data: Traffic volume data, on the other hand, helps transportation agencies understand the relationship between crashes and congested roadway segments. It can also help identify areas with higher levels of vehicle traffic, which are more likely to have a higher number of crashes. By identifying the segments with the highest volume of traffic, transportation planners can develop more effective safety interventions to reduce the likelihood of future crashes.
- Demographic data: Demographic data provides critical insights into equity considerations in safety planning. Analysts can analyze demographic data to understand how safety risks may disproportionately affect certain populations, such as low-income or minority communities. This information can help safety stakeholders develop more targeted safety interventions and ensure that equity considerations are integrated into safety planning.
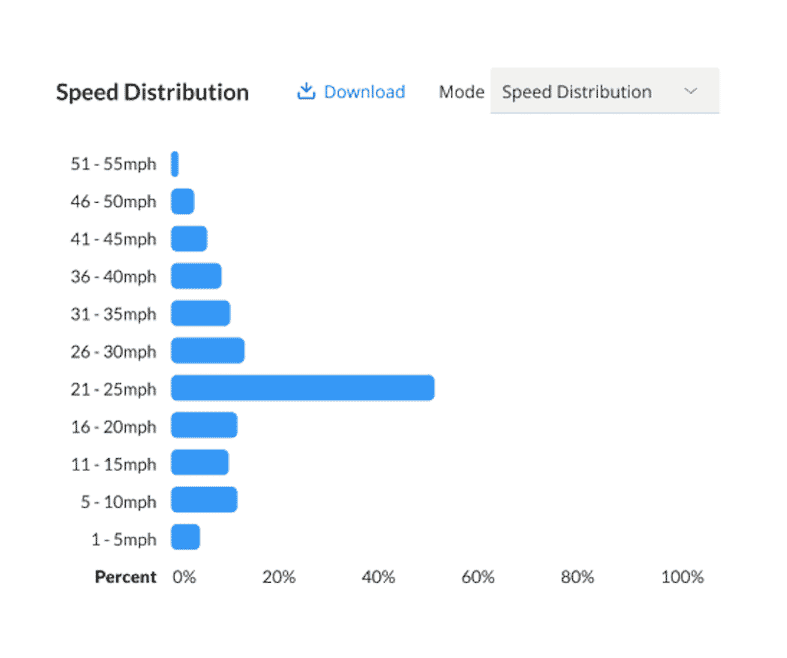
- Road Segment Risk Scores & Speed Distribution Profiles:
Road segment Risk Score and Speed Distribution Profiles provide insights into the level of risk on a particular road segment. Road segment risk scores are calculated using aggregated and anonymized connected vehicle data to provide insight into the level of risk present on a particular road segment. Speed distribution profiles help transportation agencies understand how speeds may be contributing to crash rates. By analyzing these data types, agencies can develop targeted interventions, such as reducing speed limits or improving road design, to reduce the likelihood of future crashes.
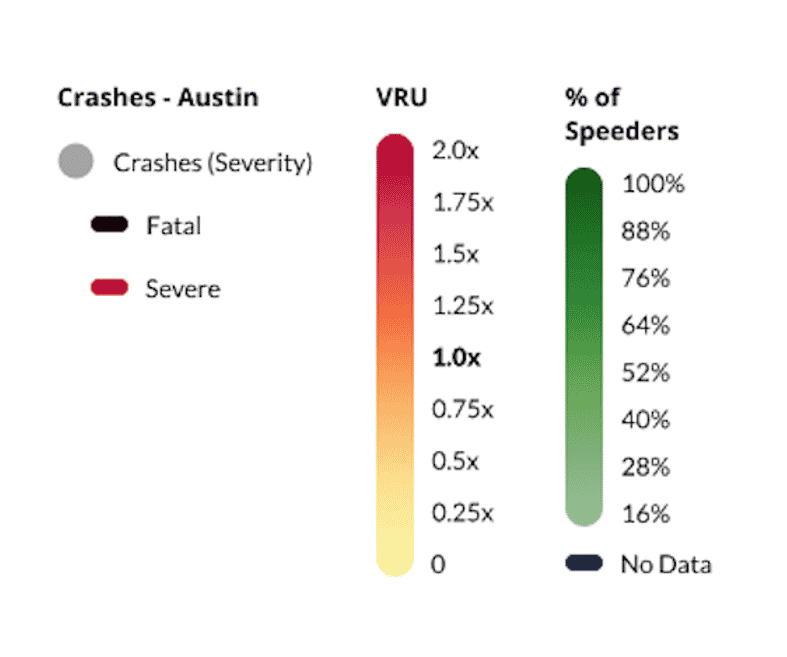
- Vulnerable Road User Index (VRU)
Finally, the Vulnerable Road User (VRU) Index helps safety stakeholders understand the level of VRU activity on particular roadway segments. VRUs include pedestrians, bicyclists, and motorcyclists, who are more vulnerable to severe injury or death in the event of a crash. By analyzing VRU activity on roadway segments, practitioners can develop targeted interventions to improve safety for these vulnerable users. The VRU index can also be used to compare roadway segments based on VRU activity and ensure that equity considerations are integrated into safety planning.
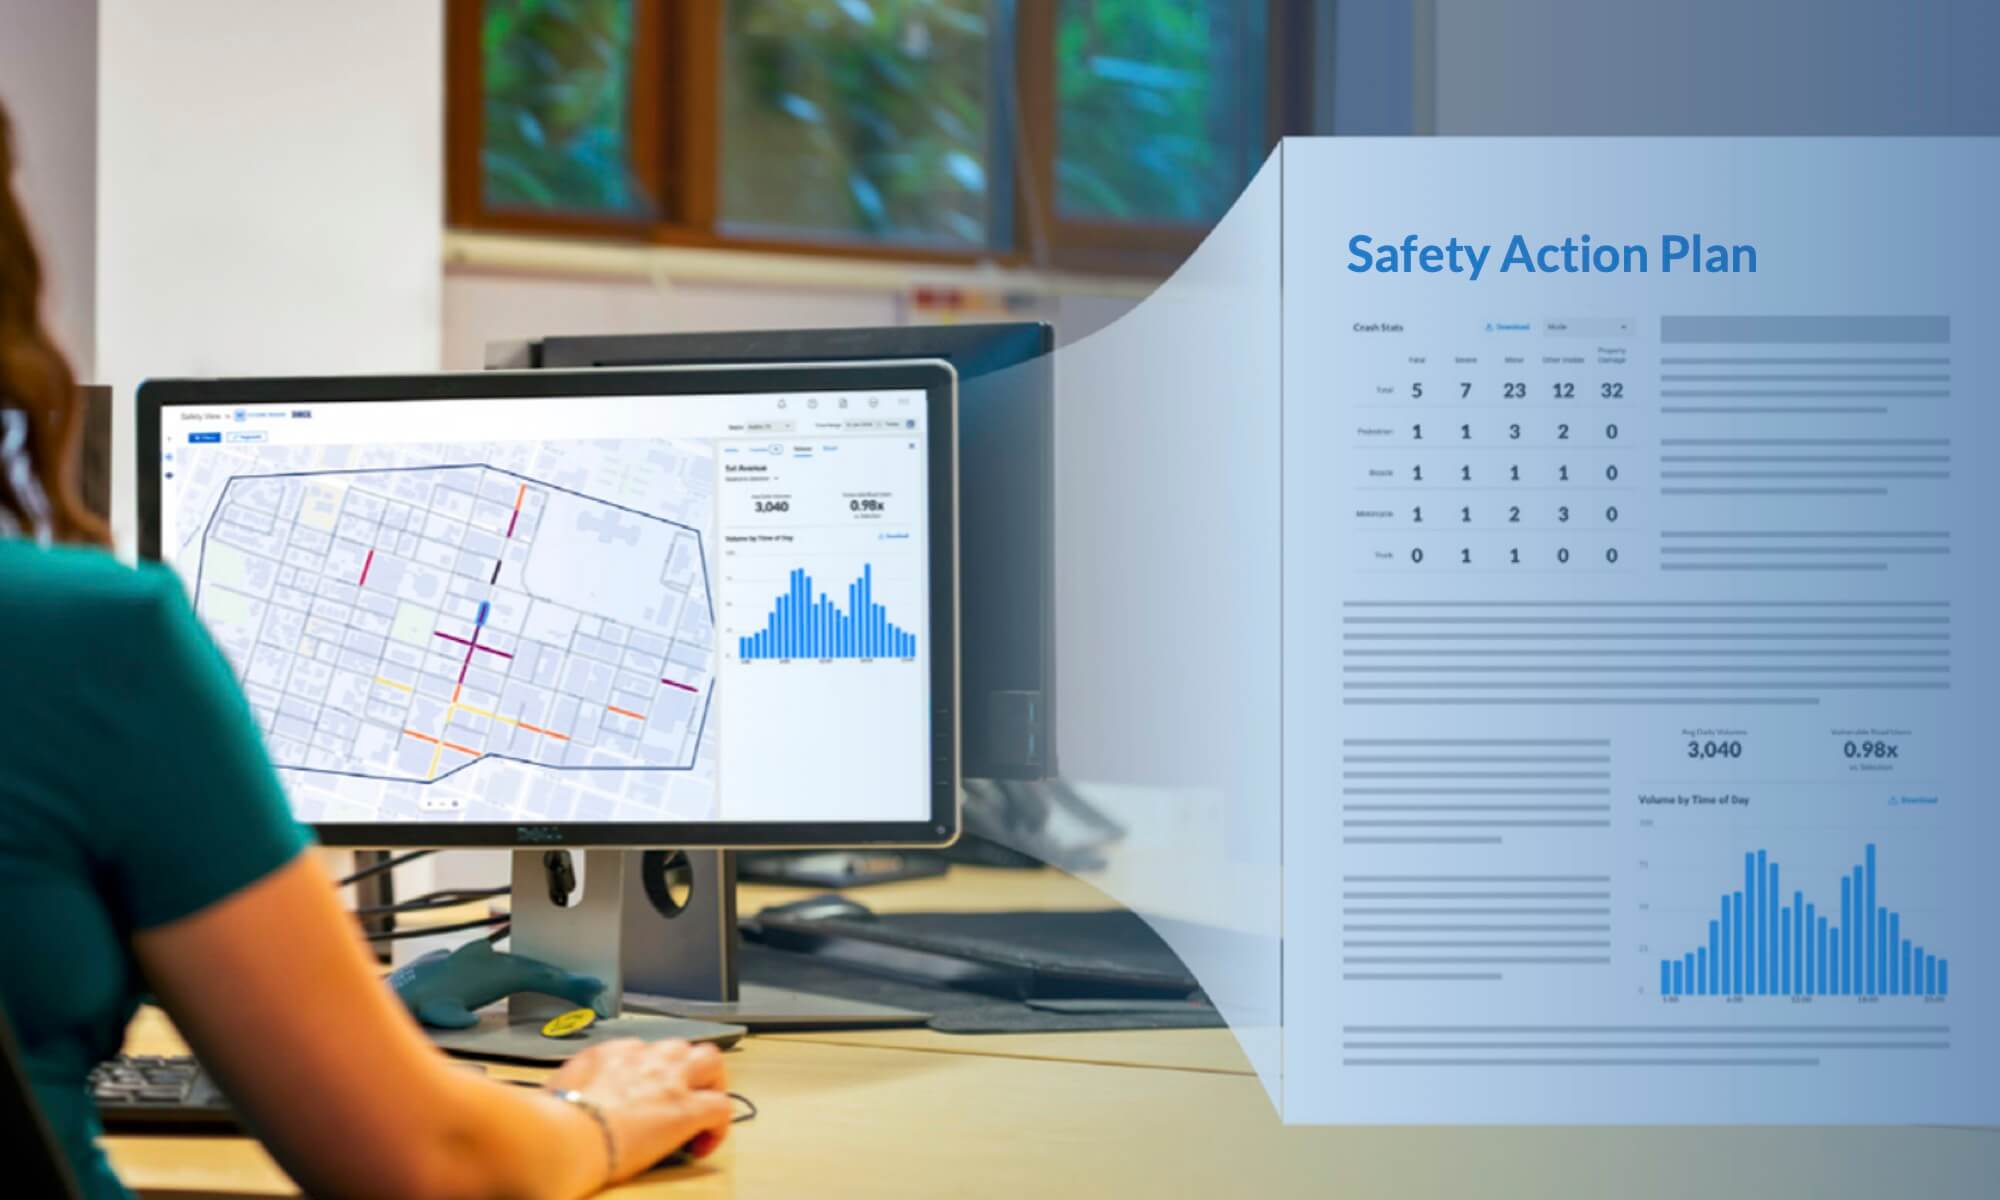
Streamline Vision Zero Planning with Safety Analytics Tools Like Safety View™
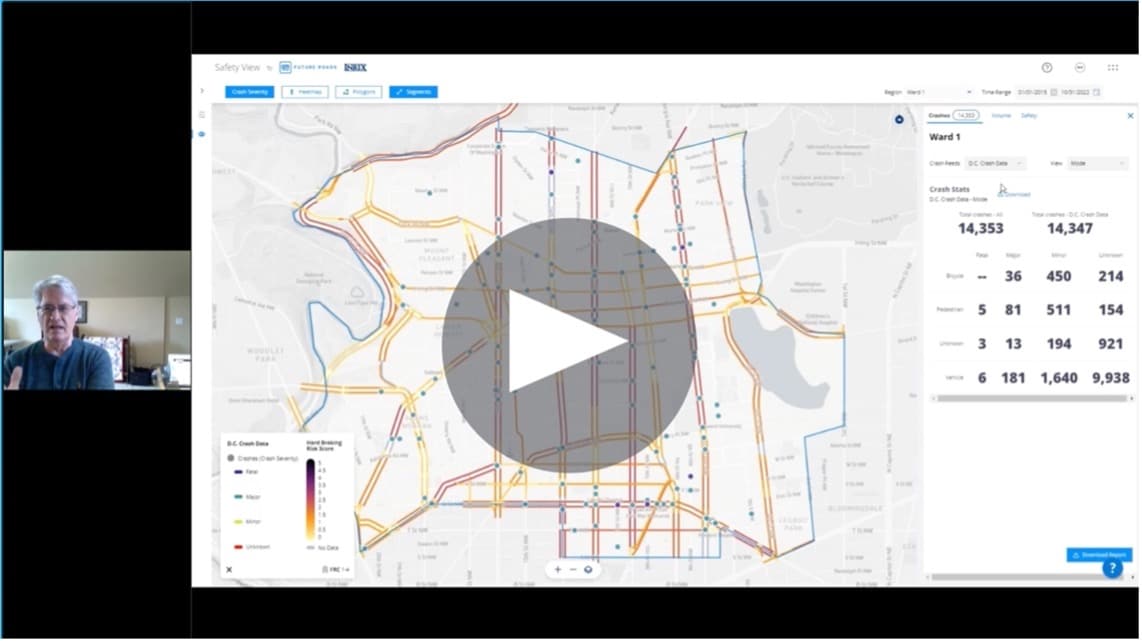
Transportation professionals face significant challenges when developing a Safety Action Plan, including time-consuming data collection and analysis, expensive field studies, and uncertainty around integrating different data types. These obstacles can make it difficult to create effective safety plans that address community needs. Fortunately, Safety View™ by GM Future Roads and INRIX can help.
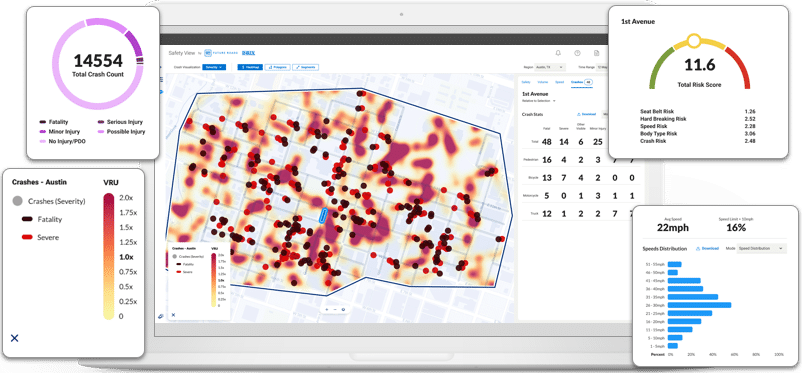
Safety View transforms essential safety data into visually compelling, data-driven insights that enable agencies to understand where safety issues are arising and the factors that might have contributed to them. This powerful application helps agencies identify high-risk areas, prioritize safety interventions, and reduce the time and costs associated with manual data collection.
Key Use Cases that Safety View Can Help with When Building a Safety Action Plan
Safety View is a versatile tool that can support transportation professionals in building comprehensive Safety Action Plans for their communities. Here are some key use cases where Safety View can be particularly helpful:
- Bike/Ped VRU Exposure Analysis: Safety View provides valuable insights into the risk factors associated with pedestrian and bicyclist traffic. By analyzing measured ped-bike traffic data, transportation professionals can identify high-risk areas and implement targeted safety treatments to reduce accidents and enhance safety for vulnerable road users.
- Safe Routes to School: Safety View can help transportation professionals analyze safety risks around schools and other landmarks. By identifying risk factors such as crashes, speeding, and hard braking, Safety View can help prioritize safety interventions and improve safety for students and other pedestrians.
- Educational Outreach: Safety View can assist transportation professionals in developing targeted educational outreach campaigns to improve safety behavior among drivers and pedestrians. For example, Safety View can help identify areas where speeding or seatbelt usage is a particular concern, allowing agencies to create focused safety campaigns.
- Equity-Integrated Safety: Safety View can help transportation professionals identify safety risks and disparities across different demographic groups. By measuring the correlation between safety risks and factors such as age, race, income, and population density, agencies can develop safety interventions that are equitable and address the needs of all members of the community.
In summary, data analytics tools like Safety View can be extremely helpful for transportation professionals tasked with developing comprehensive, data-driven Safety Action Plans. We encourage anyone who is trying to build a Safety Action Plan to explore Safety View and watch our “From Data to Action” on-demand webinar to find out exactly how it can help.