


In less than a year, the U.S. will co-host the 2026 FIFA World Cup, with the 2028 Summer Olympics in Los Angeles just two years behind it. For cities across North America, these events represent more than just a surge in tourism and media attention—they bring the potential for massive disruption to already strained transportation systems.
To better understand how large-scale international sporting events impact regional mobility, INRIX set out to compare a mid-sized international tournament to a typical domestic sporting event. Using our traffic data analysis tool, INRIX Roadway Analytics, we analyzed and compared traffic performance during the 2025 Gold Cup in Houston with an NFL Texans home game at the same venue, held on a similarly timed holiday weekend.
What we discovered offers critical insights—and warnings—for host cities tasked with managing the unpredictable chaos of event-day traffic.
Gold Cup vs. NFL: A Tale of Two Game Days
The CONCACAF Gold Cup is the premier international soccer tournament for North and Central America and the Caribbean, often featuring national teams from global powerhouses like Mexico and the U.S. While it’s not as large as the FIFA World Cup, the Gold Cup draws tens of thousands of fans, many of whom travel long distances or cross borders to attend matches.
This makes it an ideal microcosm for understanding how large-scale international events influence traffic and mobility patterns—particularly when compared to a more routine event like an NFL game.
For this study, INRIX compared:
- July 6, 2025 – Gold Cup quarterfinal at NRG Stadium in Houston
- November 24, 2024 – Texans vs. Titans NFL game at the same venue
Both events occurred on holiday weekends with similar kickoff times. This provided a rare, apples-to-apples look at how different fan types, travel behavior, and event dynamics affect the transportation network.
Key Findings from the Houston Analysis
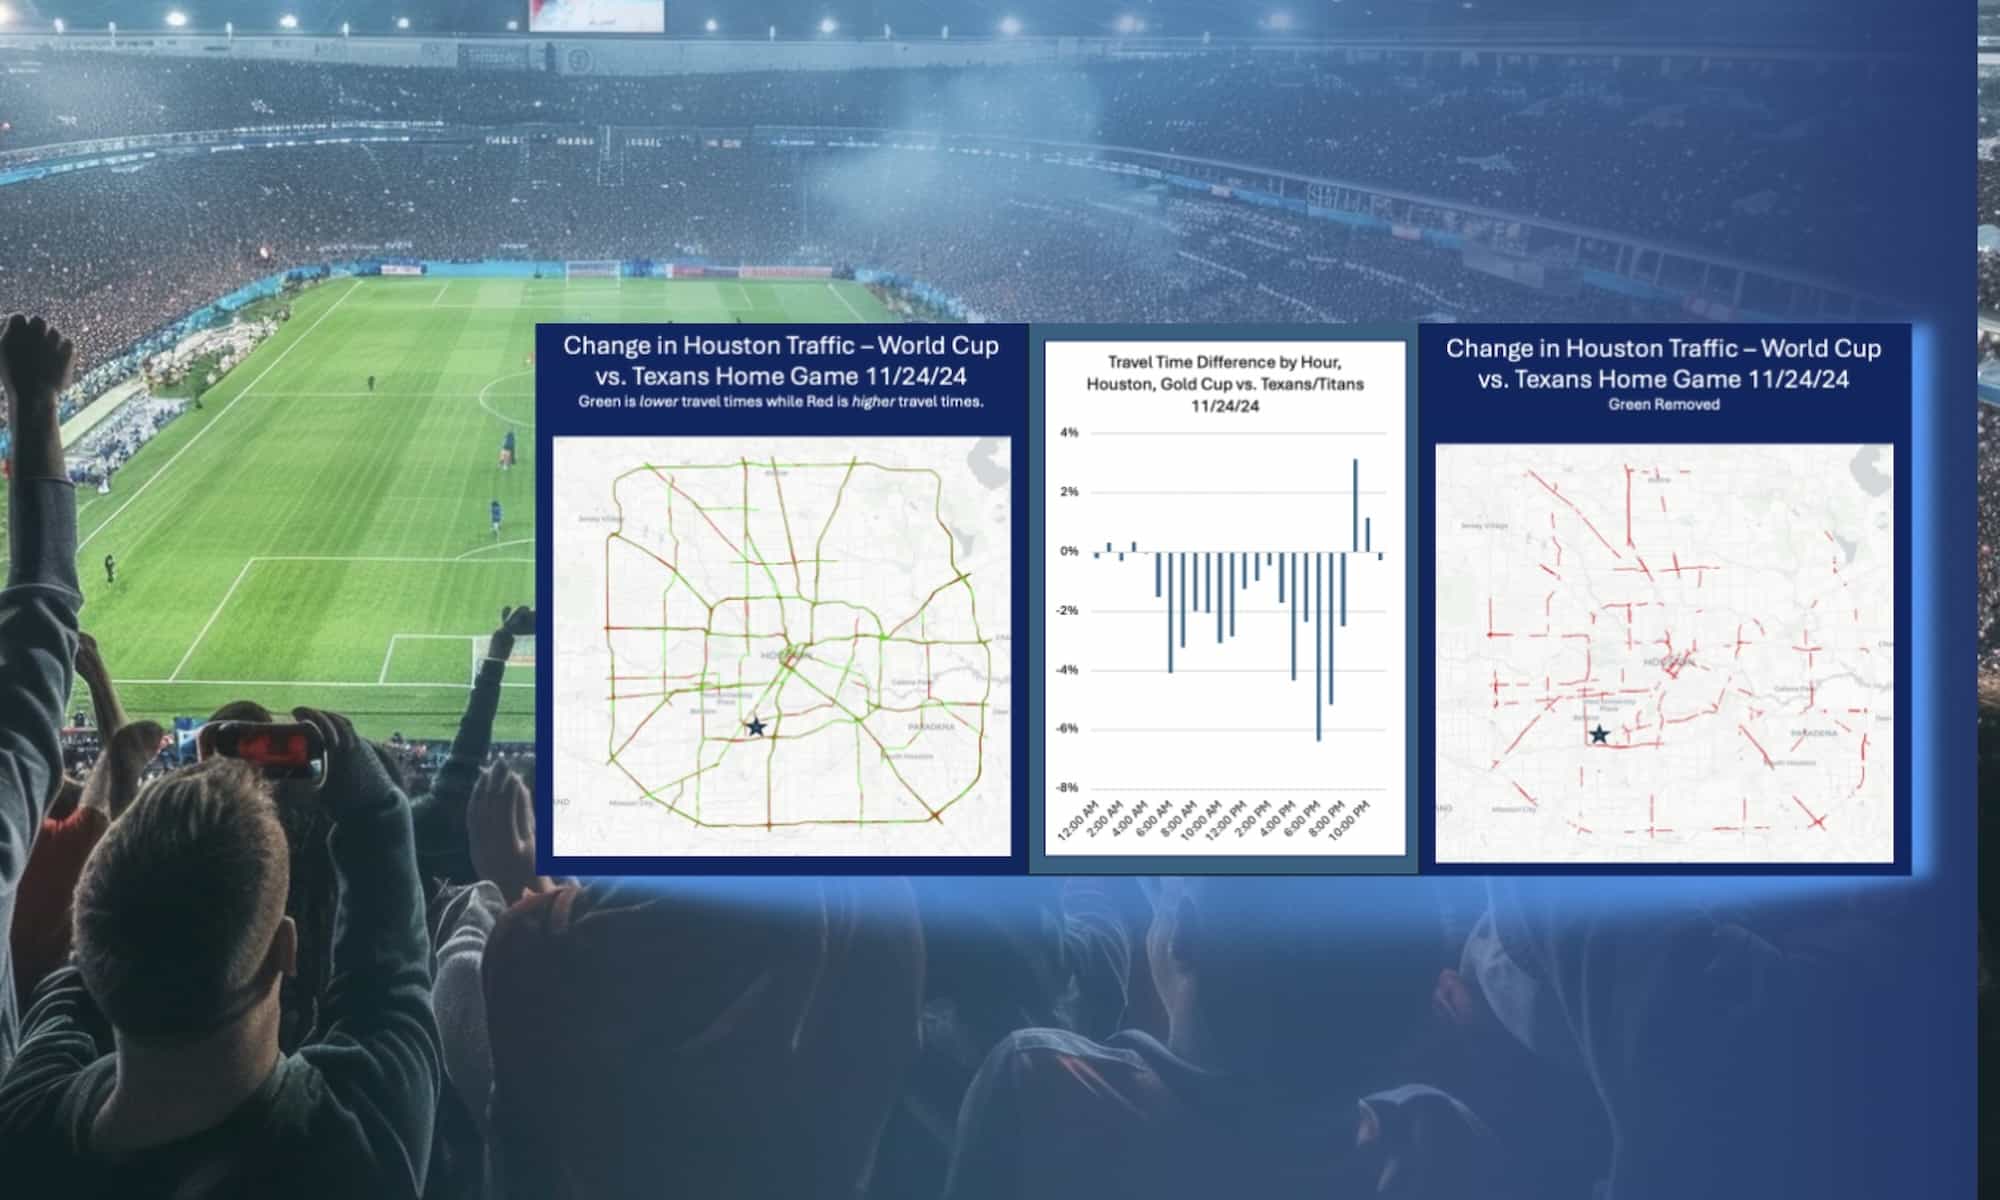
1. Less Regional Congestion During the Gold Cup
Despite being an international tournament, the Gold Cup resulted in 2–6% lower travel times across Houston compared to the NFL game. Several factors may have contributed to this:
- Holiday travel patterns: More people may have left town for the July 4th weekend.
- Later arrivals: Gold Cup fans tended to arrive closer to kickoff, leading to shorter congestion windows.
- Differences in fan behavior: Soccer events often involve less tailgating, resulting in fewer early arrivals and more compressed pre-event traffic.
2. Directional Congestion Differences
Our analysis showed that:
- Delays during the Gold Cup were concentrated in the east and south, particularly along I‑45 Northbound and I‑69 Southbound.
- Corridors from the north and west experienced smoother conditions compared to the NFL game, suggesting different origin-destination patterns based on the event.
This insight can help agencies target traffic mitigation efforts more effectively depending on the event type.
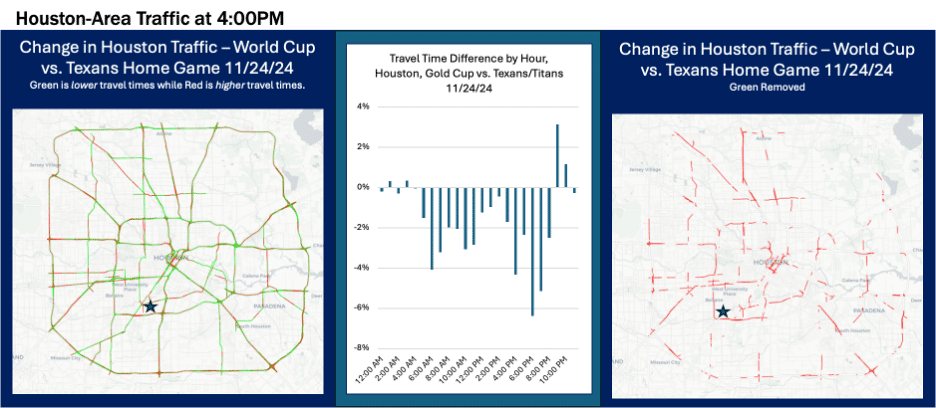
3. Congestion Spikes Came Closer to Kickoff
During the NFL game, congestion built steadily throughout the day, starting mid-morning. In contrast, Gold Cup traffic surged later, with peak congestion occurring between 2 PM and 4 PM—closer to the start of the match.
This distinction has meaningful implications for:
- Traffic signal timing
- Transit service planning
- Resource staging for law enforcement and emergency services
Corridor-by-Corridor Analysis
Using INRIX Roadway Analytics, we studied five corridors commonly used to reach NRG Stadium:
Corridor 1: SH-288 Northbound (from Beltway 8 to I-610)
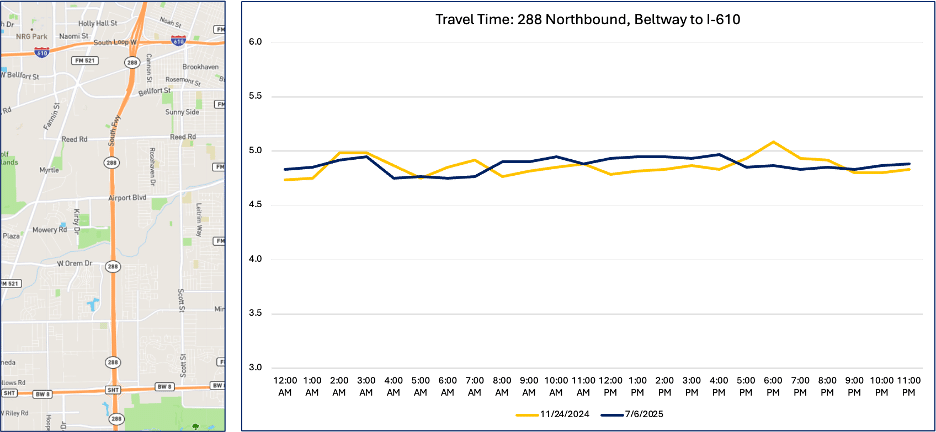
What we see: Travel times on this major approach corridor remained fairly consistent throughout both game days—staying under 5 minutes even as fans were arriving.
Why it matters: SH-288 is a primary access route to NRG Stadium from southern and southwest Houston suburbs.
What it tells us: The steady travel times suggest that this corridor had sufficient capacity, or that fans traveling from this direction staggered their arrival times. It may also reflect successful signal timing or lack of bottlenecks. For cities planning event operations, this highlights the value of identifying corridors that are critical but resilient—and ensuring they remain that way during larger events like the World Cup
Corridor 2: I-45 Northbound to NRG Stadium
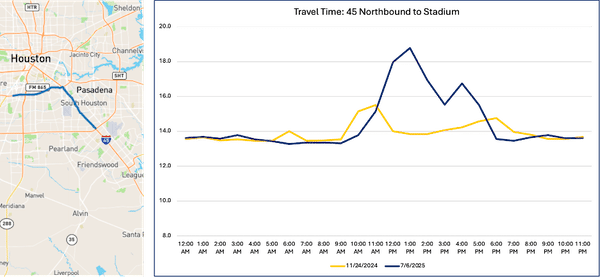
What we see: On Gold Cup match day, travel times surged around 4:30 PM—reaching a peak of nearly 19 minutes, compared to just 10 minutes on the NFL comparison day.
Why it matters: I-45 is a major regional highway that funnels fans from northern Houston and nearby cities like The Woodlands directly into central Houston and toward the stadium.
What it tells us: This route experienced one of the most severe pre-game delays, suggesting a high volume of last-minute arrivals or constrained infrastructure near the venue. For agencies, this is a corridor to watch—and manage—closely. Traffic operations teams could use past data like this to justify signal timing updates, lane reconfigurations, or improved traveler messaging in advance of large-scale international matches.
Corridor 3: I-610 Westbound to Exit 2
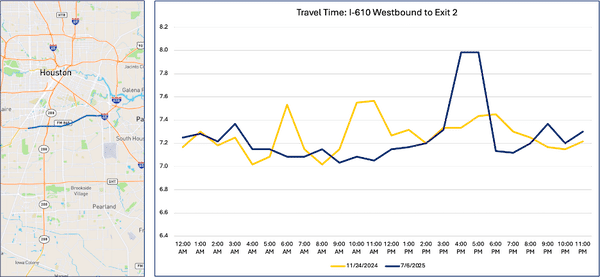
What we see: A modest traffic bump around 4 PM on Gold Cup day—rising to about 8 minutes from a baseline of 7.2.
Why it matters: This section of I-610 West connects several key arterials to the stadium area, serving as a connector rather than a long-haul approach.
What it tells us: Even marginal spikes in travel time can indicate pressure building up near the venue. This corridor shows how localized congestion may not always be sustained, but still requires planning. City engineers could use this insight to fine-tune last-mile coordination strategies and temporary road usage policies (e.g., reversible lanes or dynamic signage).
Corridor 4: I-69 Southbound to I-610 Interchange
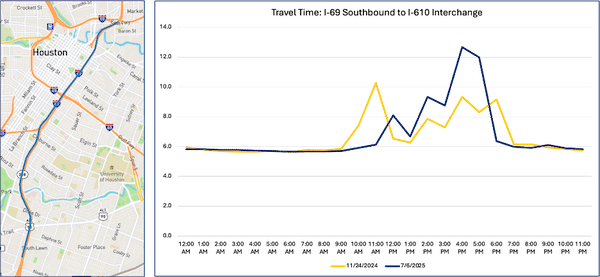
What we see: Sustained increases in travel time throughout the mid-day hours on Gold Cup day, peaking at more than 12 minutes.
Why it matters: I-69 is a major freeway feeding into I-610 and ultimately the NRG Park area—used by drivers approaching from central and northeast Houston.
What it tells us: The consistent congestion suggests this was a busy fan route during the game window. The pattern here could inform signal planning, incident management staging, or even mode shift messaging (e.g., encouraging transit use or rideshare) for World Cup games in Houston
Corridor 5: US-90 Eastbound to I-610
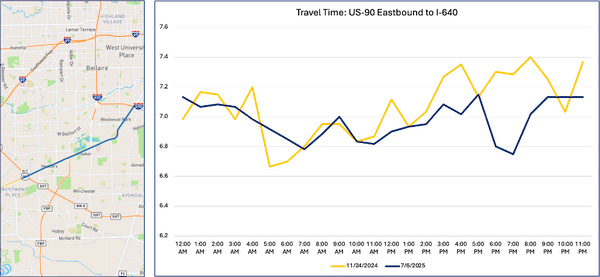
What we see: Mild but noticeable differences in traffic behavior. Game-day travel was slightly faster earlier in the day but saw a bump closer to kickoff.
Why it matters: While US-90 isn’t a top-tier access route, it acts as an alternative corridor for drivers approaching from east Houston or trying to bypass more congested areas.
What it tells us: As congestion builds on the main arterials, drivers likely explore alternate routes. Monitoring this kind of secondary corridor gives agencies an opportunity to balance network demand and adjust messaging or routing strategies dynamically. Tools like INRIX Roadway Analytics and Trip Analytics can help planners pinpoint when and how drivers make these decisions.
Each of these corridors represents a high-priority travel path to or near stadium infrastructure. With INRIX’s cloud-based tools, cities can access these insights without installing equipment—leveraging connected vehicle data to understand and plan for real-world conditions across their entire network.
What This Means for the World Cup and Olympics
While the Gold Cup is significant, the 2026 FIFA World Cup and 2028 Olympics will dwarf it in scale. These events will bring:
- Millions of domestic and international visitors
- Unfamiliar travel behaviors and routes
- Pressure on multiple venues at once
- Weekday games overlapping with commuter traffic
- Complex mobility demands across all modes
The lesson is clear: not all congestion and travel patterns are created equal. Cities can no longer rely on intuition or dated studies. They need real-time intelligence and data-driven planning tools to manage the flood of people, vehicles, and mobility services descending on their cities.
How INRIX Can Help Agencies Plan, Monitor, and Adapt for World Cup- Scale Events:
INRIX provides transportation intelligence solutions that help cities prepare before events, respond in real time, and learn what worked after the crowds leave.
Cities hosting global events face extraordinary transportation challenges—from managing surges in demand to ensuring safe, efficient access to venues. INRIX provides a suite of data-driven solutions that can help cities plan ahead to prepare before events, respond in real time, and learn what worked after the crowds leave.
Here’s how:
- Understand where and when congestion will occur
Cloud-based transportation intelligence applications like Roadway Analytics can help agencies analyze past traffic trends around stadiums, fan zones, and key routes to identify congestion hotspots and time-of-day demand. These insights help planners prepare mitigation strategies such as adjusted staffing, signage, or routing plans. - Quantify the impact of street closures on parking and curbside access
INRIX has comprehensive parking/curb data and analysis tools like Curb Analytics that can help cities assess how closing certain corridors or blocks will affect on-street parking supply, loading zones, and even parking occupancy. This allows them to make informed decisions about where to designate pick-up/drop-off areas for rideshare or delivery services. - Identify how people travel to and from venues
With detailed trip path and origin-destination insights, INRIX can help cities understand where travelers are coming from, how they get to and from venues, and which alternate routes they might take during road closures. This allows agencies to better understand real-world travel patterns during past events and to anticipate how future ones may unfold. - Evaluate and adjust traffic signal performance where it matters most
World Cup host cities can access networkwide signal performance measures without installing any equipment by using Signal Analytics. This cloud-based application leverages trillions of connected vehicle waypoints to generate detailed corridor and intersection performance metrics. These insights can help agencies evaluate performance along high-demand routes and identify where timing plans should be adjusted to accommodate event-related traffic surges—helping improve flow and minimize backups when demand peaks. - Maintain live visibility into travel conditions and incident impacts
On game day, cities need a centralized view of traffic operations to monitor travel times, detect congestion, and respond quickly to incidents. INRIX offers situational awareness tools like Mission Control that can help cities stay agile and respond to changing conditions in real-time. - Coordinate dynamically with shared mobility providers
Cities can use Ride Report to push updated restrictions, closures, or policies to TNCs and micromobility operators to ensure services are operating safely and in compliance with local requirements. Usage data also helps identify where shared mobility is being heavily used so cities can allocate resources accordingly.
After the Event: Learning What Worked (and What Didn’t)
Host cities will need to rapidly assess performance and make improvements before the next one. INRIX’s suite of transportation intelligence solutions helps agencies analyze:
- Which corridors experienced the highest delays, and whether mitigation efforts were successful
- How intersection performance changed during critical time windows and if signal timing plans worked.
- When and where congestion started and dissipated, helping refine resource deployment
This post-event feedback loop allows agencies to make data-backed adjustments for future games or large-scale events—whether that’s the next World Cup match or an Olympic opening ceremony.
Los Angeles and the 2028 Olympics: Building a Transit-First Future
The Los Angeles region is already laying the groundwork to accommodate millions of Olympic visitors. Agencies like LA Metro and LA DOT are investing in transit expansion, digital tools, and operational strategies, including:
- Twenty-Eight by ’28: A campaign to complete 28 major transportation projects before the Games, including rail lines, BRT corridors, and airport connectors.
- No-Car Olympic Vision: A commitment to reducing personal vehicle use during the Games by expanding transit and managing demand.
- Digital Coordination: Exploring dynamic tools to manage right-of-way in real time, including better integration between agencies, services, and operators.
- Public Readiness: Education and outreach efforts are critical, as many residents remain skeptical that the infrastructure will be ready in time.
With international expectations high and transportation one of the most visible pain points, Los Angeles can’t afford to rely on outdated planning models. Data-driven tools like those from INRIX can help ensure a seamless experience—for both visitors and residents.
Conclusion: The World Is Coming—Is Your City Ready?
The Gold Cup in Houston revealed how even mid-sized international events can reshape traffic flow in unpredictable ways. It also proved that each event has its own mobility fingerprint—shaped by the fan base, the time of day, the day of the week, and the city itself.
With INRIX, cities can:
- Plan smarter with historical and predictive analytics
- Respond faster with real-time insights and alerts
- Improve continuously using event-specific evaluations
The world is coming to America. And with it comes unprecedented demand on roads and transit networks. The good news? Cities don’t have to start from scratch.
With INRIX, they can plan with confidence, respond with precision, and evolve with every event.
Contact us today to prepare your city for the global stage.