


By Rick Schuman, VP, Public Sector Americas (rick@inrix.com)
This is the 15th and final edition of a weekly review of changes in road traffic demand in the United States from the COVID-19 virus spread and our collective response.[1] As summarized herein, travel now has largely recovered on a national level – though significant state and regional variances remain. If interested in detailed information with daily updates, we have introduced the INRIX Trip Trends.
Key Findings
- Overall nationwide travel increased in Week 15, reaching pre-COVID levels for the first time
- 7-day rolling passenger travel first reached 100% on Thursday, June 25th
- Nationally, when compared to typical travel,[2] Week 15 (Saturday, June 20 – Friday, June 26) saw:
- Personal travel was flat vs. down 3% in Week 14
- Long haul truck travel down 0.9% vs. 0.7% in Week 14
- Local fleets in Metro Areas down 1.7% vs. 1.7% in Week 14
- Travel decline leaders in Week 14:
- Statewide Personal Travel: Hawaii, down 43% vs. 46% Week 14, and 62% maximum
- Statewide Long Haul Truck Travel: New Mexico, down 11% vs. 10% Week 14, and 21% maximum
- Metro Area Personal Travel: Honolulu, down 28% vs. 31% Week 14, and 52% maximum
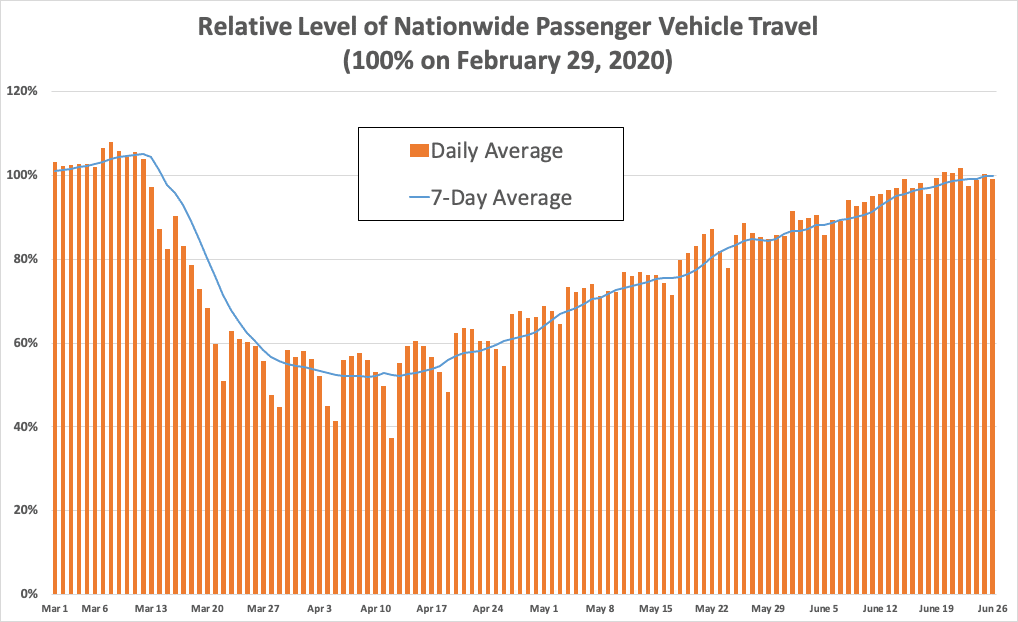
Figure 1
Background
Our incoming data sources (The ‘INRIX Fleet’) provides anonymous speed/location reporting to us in real-time and generates over 100 million trips, traveling over 1 billion total miles per day across the US. The INRIX Fleet provides information about all roads in the national network, not just major roads and spans the full range of vehicle types: consumer vehicles, local fleets, long haul trucks. We have re-purposed our INRIX Trips metadata – with only a 48-hour lag – to generate relevant summary level information about traffic demand.[3]
Synopsis
It has been 15 weeks since travel began its noticeable decline nationwide. Figure 1 shows the relative change in passenger vehicle travel from March 1, relative to the comparable day of the week during the control week of February 22 – 28, 2020. Figure 1 also includes a weekly rolling average. Passenger travel continued to trend upwards, and is now back to pre-COVID levels as of Friday, June 26th, compared to down 3% the previous Friday and 48% on April 9th the low point to date.
Four days this week registered 100% of nationwide passenger travel compared to control days – the first time since travel decline began on March 13th any day exceeded 100%. Figure 2 shows the daily figures each week, illustrating the travel declines stabilizing in Weeks 4 and 5, increasing steadily since then.
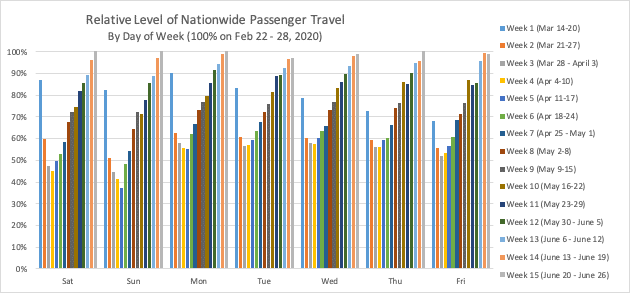
Figure 2
State Level Passenger Travel increased in 44 states compared to last week. The six states with declines were Louisiana (4%), Texas (3%), Arizona (1%) and Arkansas, Oklahoma and Mississippi with less than 1% each. Table 1 shows weekly levels by state for all 15 weeks since initial travel declines. 34 states now have personal travel exceeding the Control Week, up from 29 in Week 14. Hawaii, with its continued tourism restrictions, now far exceeds all other states with travel decline of 43%. Of the rest of the sates, only California (12%) and Arizona (11%) have declines exceeding 10%.
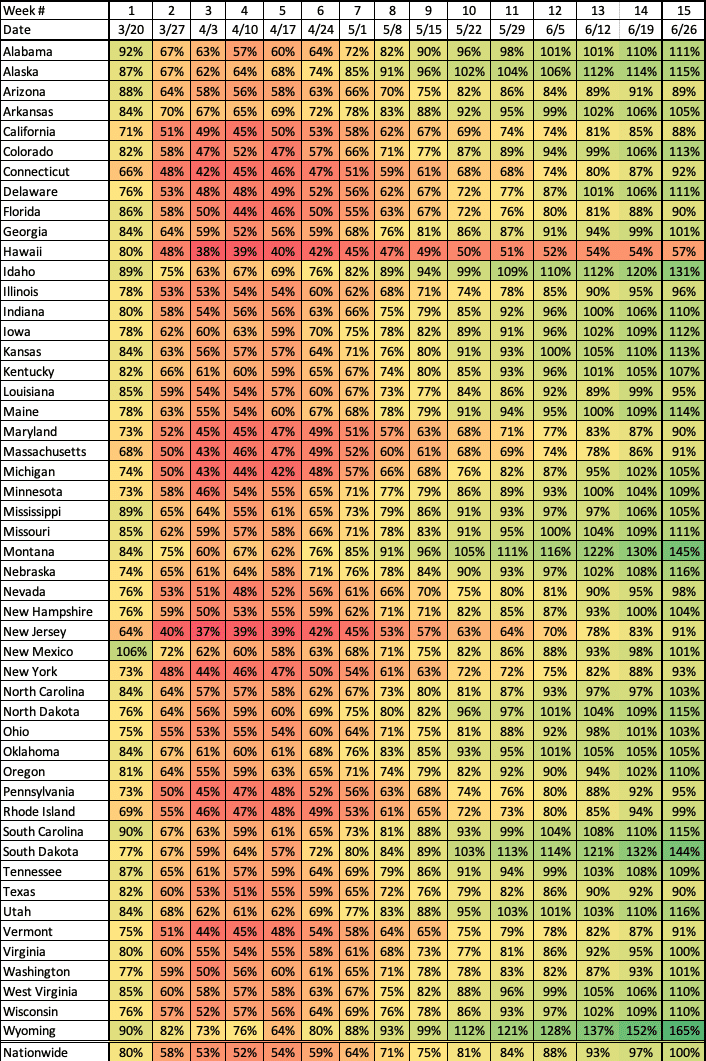
Table 1 – Weekly Average Personal Travel by State – % of Control Week Travel
Nationwide Long Haul Truck travel was relatively flat in Week 15, now down 0.9% compared to 0.7% in Week 14. 32 states now have long haul truck travel exceeding the Control Week, up from 30 states in Week 14. Like last week, only New Mexico (11%) and Texas (10%) have reductions of 10% or more. Michigan, which for several weeks had been the most severely impacted state, was flat Week 15, fully recovered from a peak reduction of 38% on April 16th.
Metropolitan Area[4] personal travel increased overall again this week, with 86 of the 98 metropolitan areas tracked increasing in Week 15. Declines were concentrated in Texas (6 areas), Arizona (2 areas), and Louisiana (2 areas). 42 areas have now fully ‘recovered,’ up from 25 areas in Week 14.
The ten largest reductions in travel in Week 15 were:
-
- Honolulu: 28% (31% last week)
- Miami: 25% (27% last week)
- Orlando: 24% (25% last week)
- San Francisco: 24% (27% last week)
- McAllen, TX: 23% (19% last week)
- Fort Myers: 20% (22% last week)
- Phoenix: 19% (17% last week)
- Washington, DC: 18% (22% last week)
- Tucson: 17% (17% last week)
- Houston: 17% (10% last week)
The New York City area, which had the largest recorded drop of any area at any point, 66% on April 3rd, was down 15% in Week 15, ranked 15th. In Week 14, New York City was down 22% and ranked 6th nationwide.
Overall local fleet traffic in metropolitan areas held steady in Week 15, down 1.7%, same as Week 14.
Seasonal Adjustments
According to the Federal Highway Administration, the average daily national vehicle miles traveled in June 2019 was 16.5% higher than the daily average in February 2019.[5] Thus, for every 100 miles traveled in the US last week, we could have expected 116.5 miles if not for the virus. Meaning, getting back to pre-COVID travel levels in June implies a 16.5% reduction, seasonally adjusted. This calculation is included for illustrative purposes and to remind readers that, depending upon when the indices shown in this Synopsis return to ‘normal’ compared to the Control Week, they may or may not indicate full recovery on a seasonally adjusted basis.
Given travel is nominally back to pre-COVID levels on a national aggregate basis, and the Independence Day holiday weekend will surely skew the next two weeks of data from ‘typical,’ this will be the last weekly synopsis. INRIX will continue to publish reports of interest as and when appropriate. For those interested in the day-to-day nuances of travel trends, the INRIX Trip Trends Dashboard is available for licensing.
INRIX Trip Trends Dashboard Chart of the Week
The final chart of the week shows the diverging trends of the New York City and Houston metropolitan areas. New York (yellow) has lagged the national average (red) from the beginning but is now rising faster than the national average. Houston (green) has largely mirrored the national average until the past few weeks. It has trended significantly downward since June 15th and is now lower than the New York City area on a relative basis.
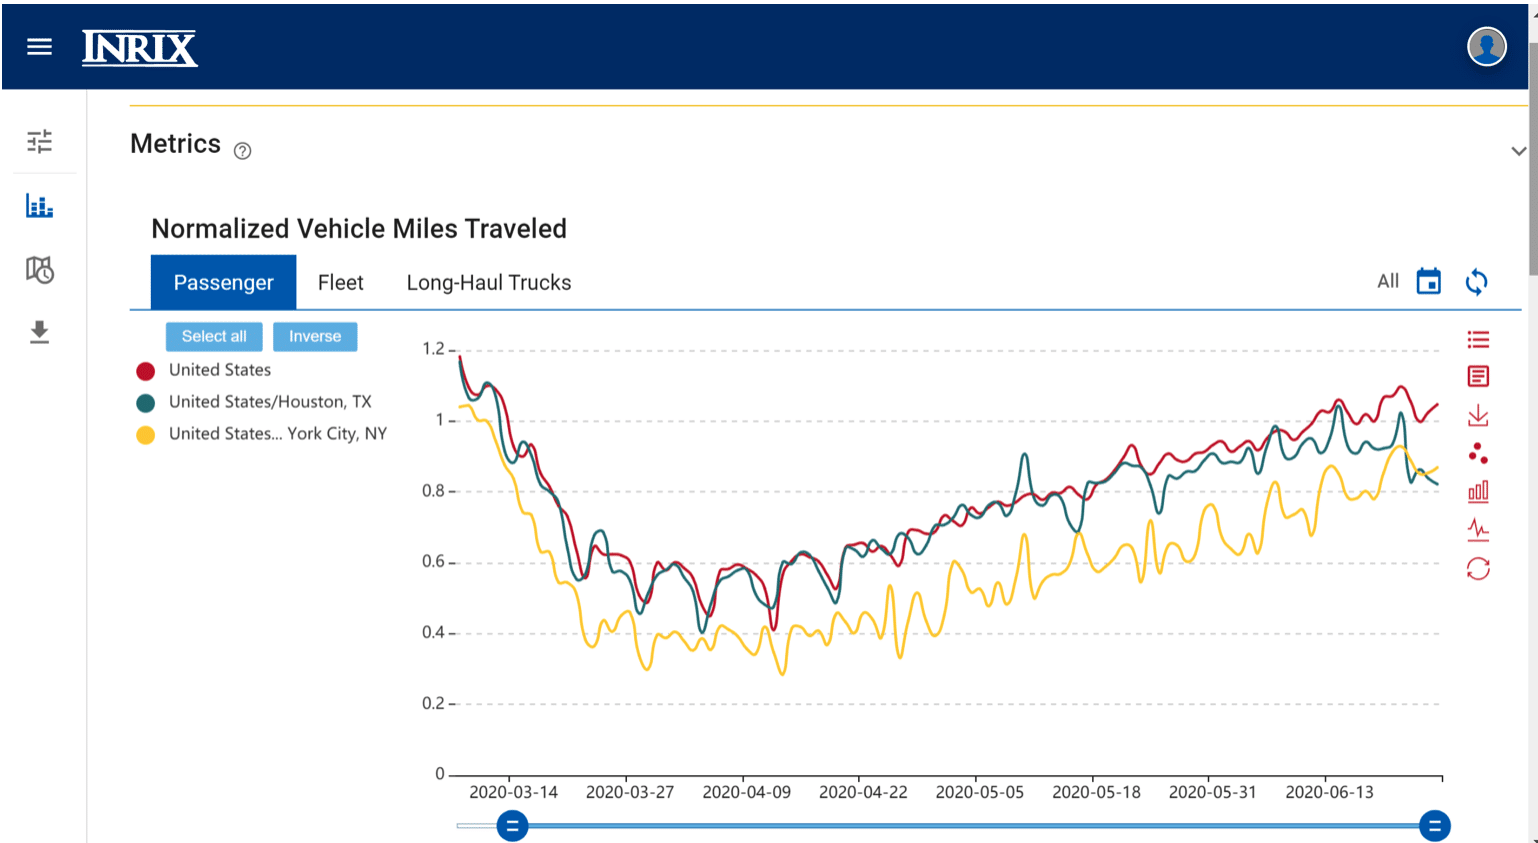
Figure 3 – County level detail in INRIX Trip Trends Dashboard
[1] Previous Issues and other COVID-related information can be found on the INRIX COVID page
[2] Given the day of week pattern of travel demand, we compare a given day and area to the same day/area in a previous week, and we are using the week commencing Saturday, February 22, 2020 as our ‘control week’
[3] Metadata used is total trip distance of all INRIX Trips originating in the country/state/region each day
[4] INRIX has established 98 metropolitan area geographies for internal purposes; these are the areas used in this analysis
[5] https://www.fhwa.dot.gov/policyinformation/travel_monitoring/tvt.cfm