


This has been a challenging year for predicting traffic. As you’d expect, travel projections went largely out the window with COVID-19. From state agencies’ revenue projections, to transit use, to the lack of a morning and afternoon commute, few could have seen this coming. Even three months later, many things are still unknown – like the permanency of the rise in telecommuting, whether transit ridership will rebound in areas like New York and D.C., and a possible resurgence of the virus and the related impacts to nearly everything around us.
That being said, we drew upon some historical and recent data to get a fuller picture of what drivers may experience this Fourth of July weekend.
Vehicle-miles traveled is still down across the country and in many states.
Vehicle-miles traveled (VMT) is one of the most important transportation metrics to follow. Vehicle-miles traveled statistics provide transportation planners, engineers, public agencies and businesses key metrics to measure travel volumes. Travel volumes affect agency budgets, fleet operations, benefit/cost analyses and building impacts on the road network.
Using INRIX Trip trends, we can also measure how COVID-19 is affecting each state and metropolitan area individually. As of June 19th, 29 states have exceeded their pre-COVID (end of February) levels of miles traveled. Yet many states still lag, with Hawaii, New Jersey and California being the lowest at 54%, 83% and 85% of pre-COVID VMT, respectively.
| State | % of Pre-COVID VMT | State | % of Pre-COVID VMT |
| Alabama | 110% | Montana | 130% |
| Alaska | 114% | Nebraska | 108% |
| Arizona | 91% | Nevada | 95% |
| Arkansas | 106% | New Hampshire | 100% |
| California | 85% | New Jersey | 83% |
| Colorado | 106% | New Mexico | 98% |
| Connecticut | 87% | New York | 88% |
| Delaware | 106% | North Carolina | 97% |
| Florida | 88% | North Dakota | 109% |
| Georgia | 99% | Ohio | 101% |
| Hawaii | 54% | Oklahoma | 105% |
| Idaho | 120% | Oregon | 102% |
| Illinois | 95% | Pennsylvania | 92% |
| Indiana | 106% | Rhode Island | 94% |
| Iowa | 109% | South Carolina | 110% |
| Kansas | 110% | South Dakota | 132% |
| Kentucky | 105% | Tennessee | 108% |
| Louisiana | 99% | Texas | 92% |
| Maine | 109% | Utah | 110% |
| Maryland | 87% | Vermont | 87% |
| Massachusetts | 86% | Virginia | 95% |
| Michigan | 102% | Washington | 93% |
| Minnesota | 104% | West Virginia | 106% |
| Mississippi | 106% | Wisconsin | 109% |
| Missouri | 109% | Wyoming | 152% |
| Nationwide – 97% | |||
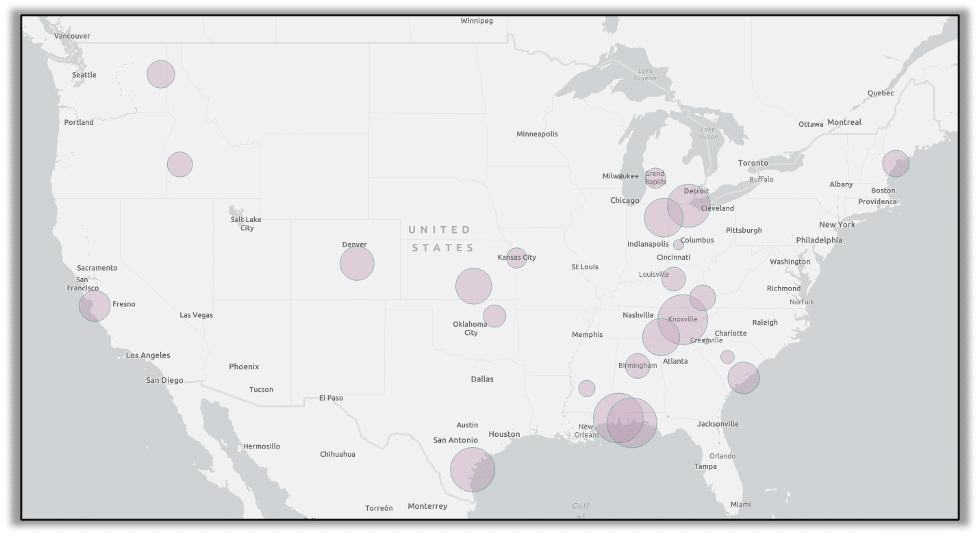
States are returning to ‘normal’ VMT, but Metropolitan Areas lag behind
While more than half of states have seen traffic levels rebound to pre-COVID levels, just 25% of the largest Metropolitan Statistical Areas (MSAs) studied have reached their previous highs, indicated by the map below, with a notable in absence of many East and West Coast cities, the Southwestern United States, and other big regions in Minnesota, Missouri, Pennsylvania and Illinois:
The data suggests that suburban, exurban and rural areas have seen a significantly larger rebound in VMT than dense, urban cores. In addition, our data reveals that Central Business Districts in every major city is far below their pre-COVID highs. This inactivity, in turn, is reflected in commute speeds that are far above what is typically seen in these urban areas, even as VMT has been increasing.
While VMT will be closer to ‘normal’ in most states, we expect to see less than usual traffic congestion around core cities this Fourth than in previous years, as holiday traffic will blend with minimal commuting traffic – especially in the morning period.
Memorial Day Traffic
To gain some insight into Fourth of July travel, we ran analysis on Memorial Day traffic, as both are ‘weekend’ holidays this year. Though trips are down due to COVID, INRIX data reveals that distance per trip on the Friday before the weekend were up over last year in most major metropolitan areas, especially in Seattle (+17%), Houston (+14%), San Francisco (+13%), Washington DC (+13%) and Los Angeles (+13%).
This may be due to a number of factors, including the substitution of air/rail trips with vehicle trips. In addition, holiday travel trips may have been a larger percentage of trips on the road (fewer people commuting means travel trips make up a larger portion of trip purposes on the road).
| MSA | Increase in Trip Length vs 2019 |
| Atlanta, GA | 11% |
| Boston, MA | 6% |
| Chicago, IL | 12% |
| Dallas, TX | 11% |
| Detroit, MI | -3% |
| Houston, TX | 14% |
| Los Angeles, CA | 13% |
| Miami, FL | 0% |
| Minneapolis, MN | 9% |
| New York, NY | 6% |
| Philadelphia, PA | 2% |
| Phoenix, AZ | -1% |
| San Francisco, CA | 13% |
| Seattle, WA | 17% |
| Washington, DC | 13% |
If Memorial Day trends hold through July 4, we can expect a large increase in trip lengths around many metropolitan areas. If VMT continues to rise more toward normal levels, we may see a return closer to ‘normal’ traffic congestion levels, especially at key choke points to/from popular travel destinations.
However, it is important to note, again, that as of this writing many states are considering implementing travel and quarantine restrictions to combat a second wave of COVID. Those restrictions will likely have a large impact on travel that could change holiday travel traffic dramatically.