


In our previous post, we explored how Active Transportation and Demand Management (ATDM) is transforming traffic management from reactive to proactive. We introduced four proven strategies that agencies are using to tackle congestion without massive infrastructure investments.
For agencies considering ATDM implementation, the key questions are:
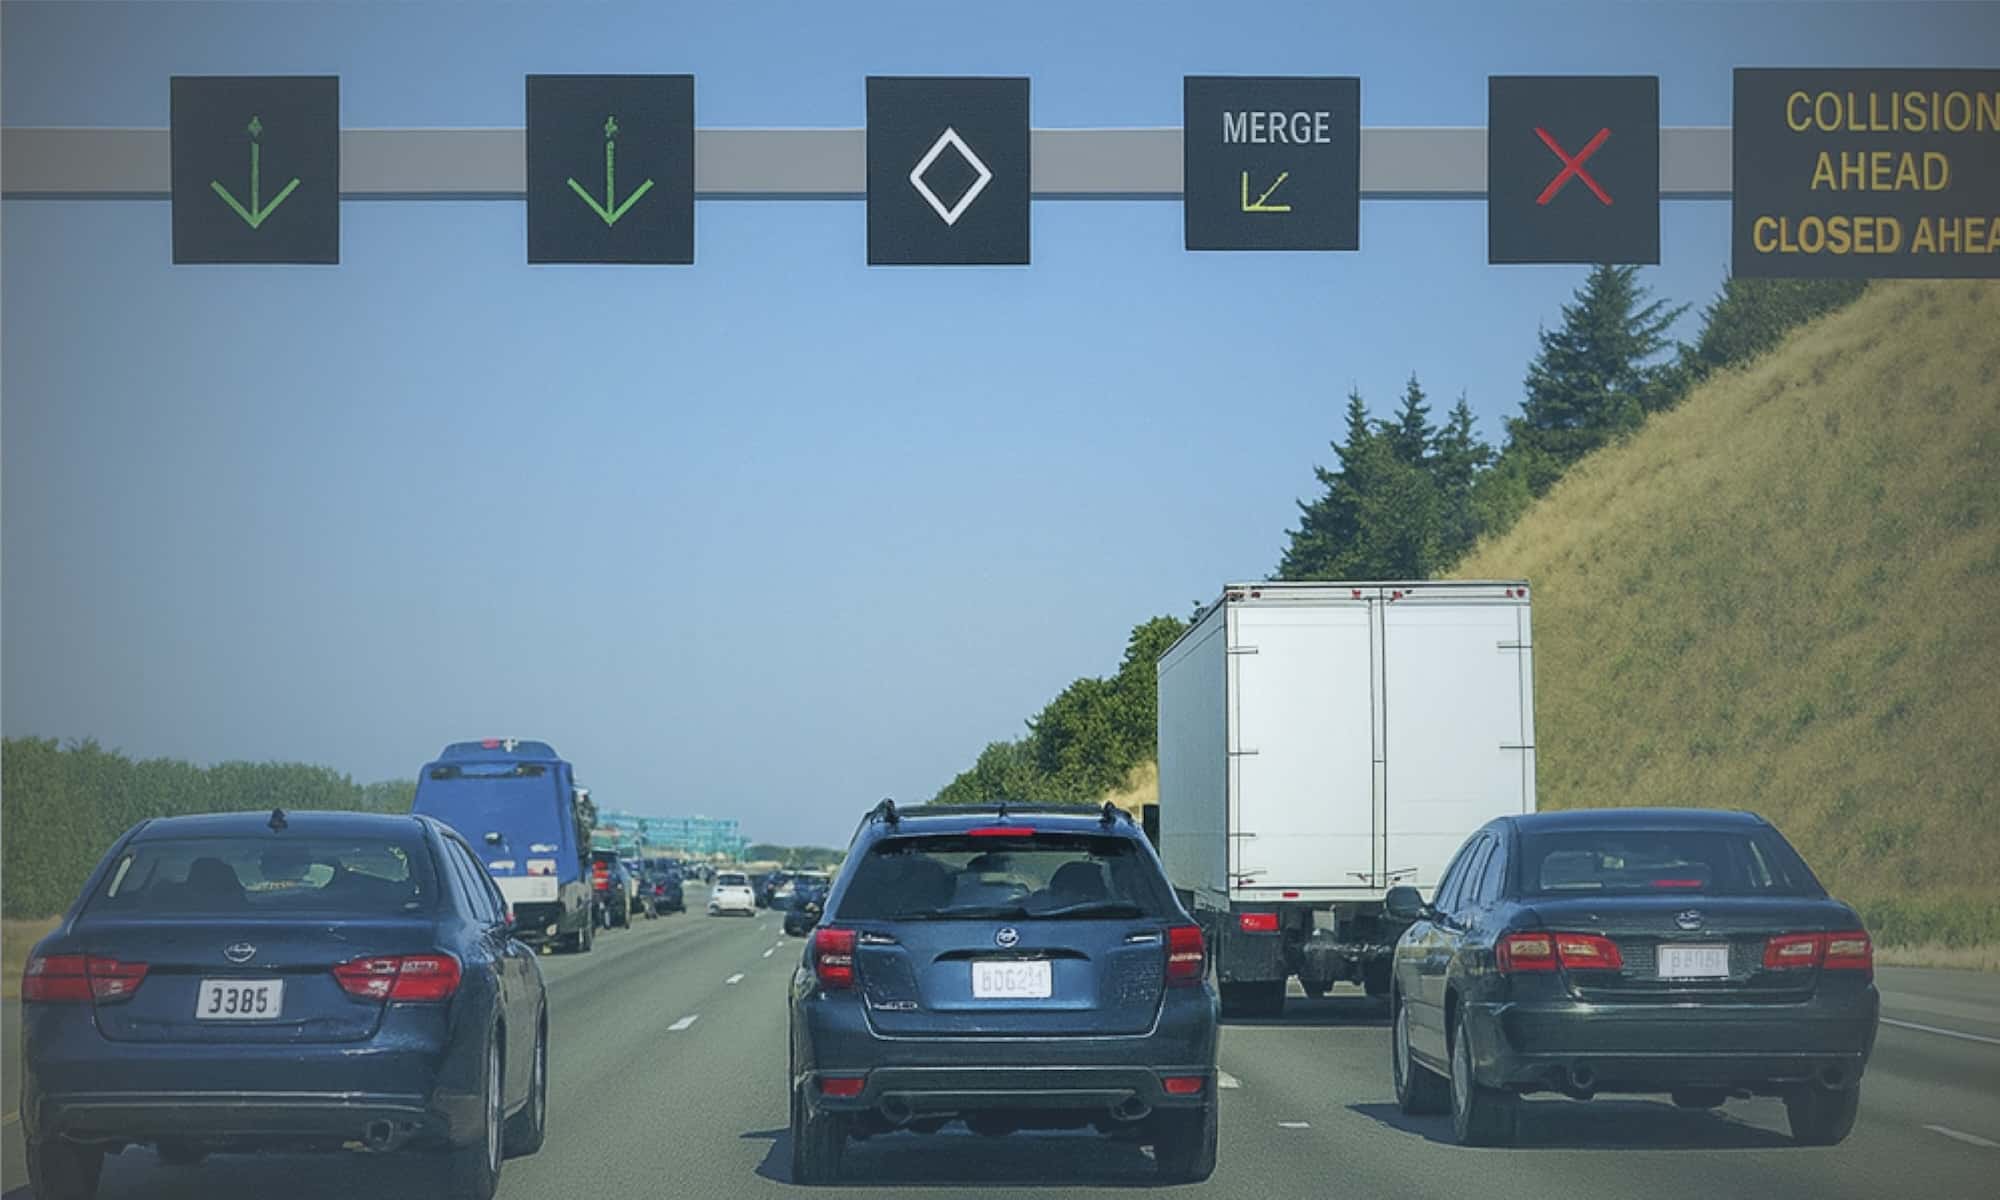
This post examines real-world deployments of four ATDM strategies—Part-Time Shoulder Use, Variable Speed Limits, Queue Warning Systems, and Adaptive Ramp Metering—with actual results from agencies who’ve made them work. Each example shows a bit of what’s possible as well as documented benefits.
This post explores when to deploy each strategy, how they work in practice, and most importantly—what kind of results your agency can expect.
Strategy 1: Part-Time Shoulder Use (PTSU)
When to Deploy
Part-time shoulder use makes sense when:
How It Works
PTSU converts an existing shoulder into a travel lane during specific hours, typically guided by real-time traffic conditions. On Ohio’s I-670, overhead lane control signs indicate when the shoulder is open, dynamic message boards alert drivers to the operational status, and speed limits are posted for the shoulder lane.
The shoulder opens when speeds drop below predetermined thresholds and closes when traffic returns to free-flow conditions. It’s dynamic capacity that appears when needed and disappears when it’s not.
Data Requirements
Successful PTSU deployment relies on traffic intelligence throughout the corridor. Agencies need to understand both when congestion occurs and how severe it becomes to set appropriate operating parameters. The shoulder becomes an active part of the traffic management system, requiring the same level of monitoring as regular travel lanes.
Successful PTSU deployment needs:
Ohio’s I-670 SmartLane: Proven Results
ODOT’s I-670 SmartLane transformed a notorious bottleneck. Before implementation, afternoon commutes varied wildly between 10 and 20 minutes for the same 4-mile stretch. After deployment, travel times dropped dramatically—from an average of 20 minutes to just 5 minutes. More importantly, reliability improved, with consistent 5-6 minute commutes replacing the previous unpredictability.
The project delivered these results without years of construction or hundreds of millions of dollars. Instead, by using existing right-of-way more intelligently—guided by INRIX data throughout the planning process—ODOT created a cost-effective solution that dramatically improved the commute for thousands of daily travelers.
Learn more about the I-670 SmartLane project
Strategy 2: Variable Speed Limits (VSL)
When to Deploy
Variable speed limits work best for:
How It Works
VSL systems use digital signs that display dynamic speed limits between based on real-time conditions. Vehicle detectors collect traffic speed and volume data, which feeds into software that recognizes when traffic approaches unstable conditions. The system then assigns incrementally lower speeds to harmonize traffic flow. Some VSL systems are manually changed based on operators monitoring data and conditions. Other VSL systems are more automated.
Speed reductions typically happen gradually, allowing drivers to adjust speeds safely. When congestion clears, limits return to the default statutory speeds.
Data Requirements
VSL systems are only as smart as the data that feeds them. The technology must detect congestion formation early enough to implement gradual speed reductions before drivers encounter stopped traffic. This requires a dense network of speed detector and sophisticated algorithms to distinguish between temporary slowdowns and developing bottlenecks.
Essential data elements include:
Virginia’s I-95 Success Story
VDOT implemented VSL along 15 miles of I-95 northbound south of Fredericksburg. The results exceeded expectations: fatal and serious crashes decreased by 13 percent in the VSL zones. The system also delivered a 20+ percent reduction in severe crashes resulting in fatalities and injuries.
Beyond safety improvements, the system changed driver behavior. Speed limit compliance improved significantly, with fewer instances of excessive speeding throughout the corridor.
Read the Virginia DOT case study
Strategy 3: Queue Warning Systems
When to Deploy
Queue warning systems are critical when:
How It Works
Modern queue warning systems use speed data to detect where traffic is backing up in real-time. When speeds drop below thresholds, automated messages appear on upstream message signs, alerting drivers to the queue location and distance. Messages update automatically as conditions change.
Unlike traditional systems requiring physical detectors, some virtual systems leverage existing probe data for corridor-wide coverage at a fraction of the cost.
Data Requirements
Effective queue warning depends on detecting the precise location of traffic backups and tracking how they grow or shrink over time. Unlike static warning systems, modern deployments need to identify where the actual end of queue is located—which can move by miles throughout a single rush hour. The faster the detection, the more time drivers have to react safely.
Critical data components include:
PennDOT’s Virtual Innovation
PennDOT’s Virtual Queue Protection Corridors revolutionized queue warning by eliminating the need for physical infrastructure. Across 11 corridors, total crashes dropped from 1,808 to 1,625 per year—an 11% reduction. The system particularly benefited truck safety, with rear-end crashes involving trucks down 13% and fatal truck crashes reduced by nearly 50%.
The financial impact is equally impressive: the reduction of 183 crashes annually translates to $53.4 million in savings for Pennsylvania drivers. Travel time savings add another $2.2 million in benefits.
Strategy 4: Adaptive Ramp Metering
When to Deploy
Adaptive ramp metering fits corridors with:
How It Works
Adaptive systems use algorithms that consider freeway and ramp volumes, then adjust metering rates for optimal flow along the entire corridor. Unlike fixed-time meters, adaptive systems respond to real-time conditions—increasing flow when the mainline has capacity and restricting it when congestion builds.
The best systems coordinate multiple ramps as a unified network, preventing the problem of simply moving congestion from one ramp to another.
Data Requirements
Adaptive metering goes beyond individual ramp control—it requires understanding how the entire corridor functions as a system. The algorithm needs to balance competing demands: maximizing mainline flow, preventing ramp backups onto city streets, and ensuring equity across different entry points. This balance demands ample data from both the freeway and surrounding roadway network.
Essential data inputs include:
California’s I-80 Corridor Transformation
California’s I-80 corridor implemented coordinated ramp metering across 28 miles with 44 ramp meters. The results demonstrate the power of corridor-wide thinking: vehicle hours traveled dropped 2-9% during peak periods, while travel time reliability improved 7-20% as measured by the Planning Time Index.
The $79 million I-80 SMART Corridor Project proves that adaptive metering at scale can transform entire corridors. By treating all on-ramps as a coordinated system rather than individual bottlenecks, the project optimized flow for the entire East Bay commute.
Making the Right Choice for Your Agency
Each ATDM strategy addresses specific challenges:
Start with safety? VSL and queue warning systems can deliver immediate crash reductions. Virginia and Pennsylvania proved 13-50% reductions in serious crashes are achievable.
Need capacity fast? Part-time shoulder use provides relief in months, not years. Ohio added a lane’s worth of capacity for a fraction of traditional costs.
Fighting merge bottlenecks? Adaptive ramp metering optimizes existing capacity. California showed that travel time improvements are possible without adding lanes.
The key is matching strategy to the demand. But regardless of which approach you choose, success also depends on accurate and comprehensive data.
INRIX data plays a role in each of these success stories—from identifying problems in planning to triggering real-time responses in operations to proving results in evaluation. The same data that helps agencies select the right strategy can also enables its operation and validates its success.