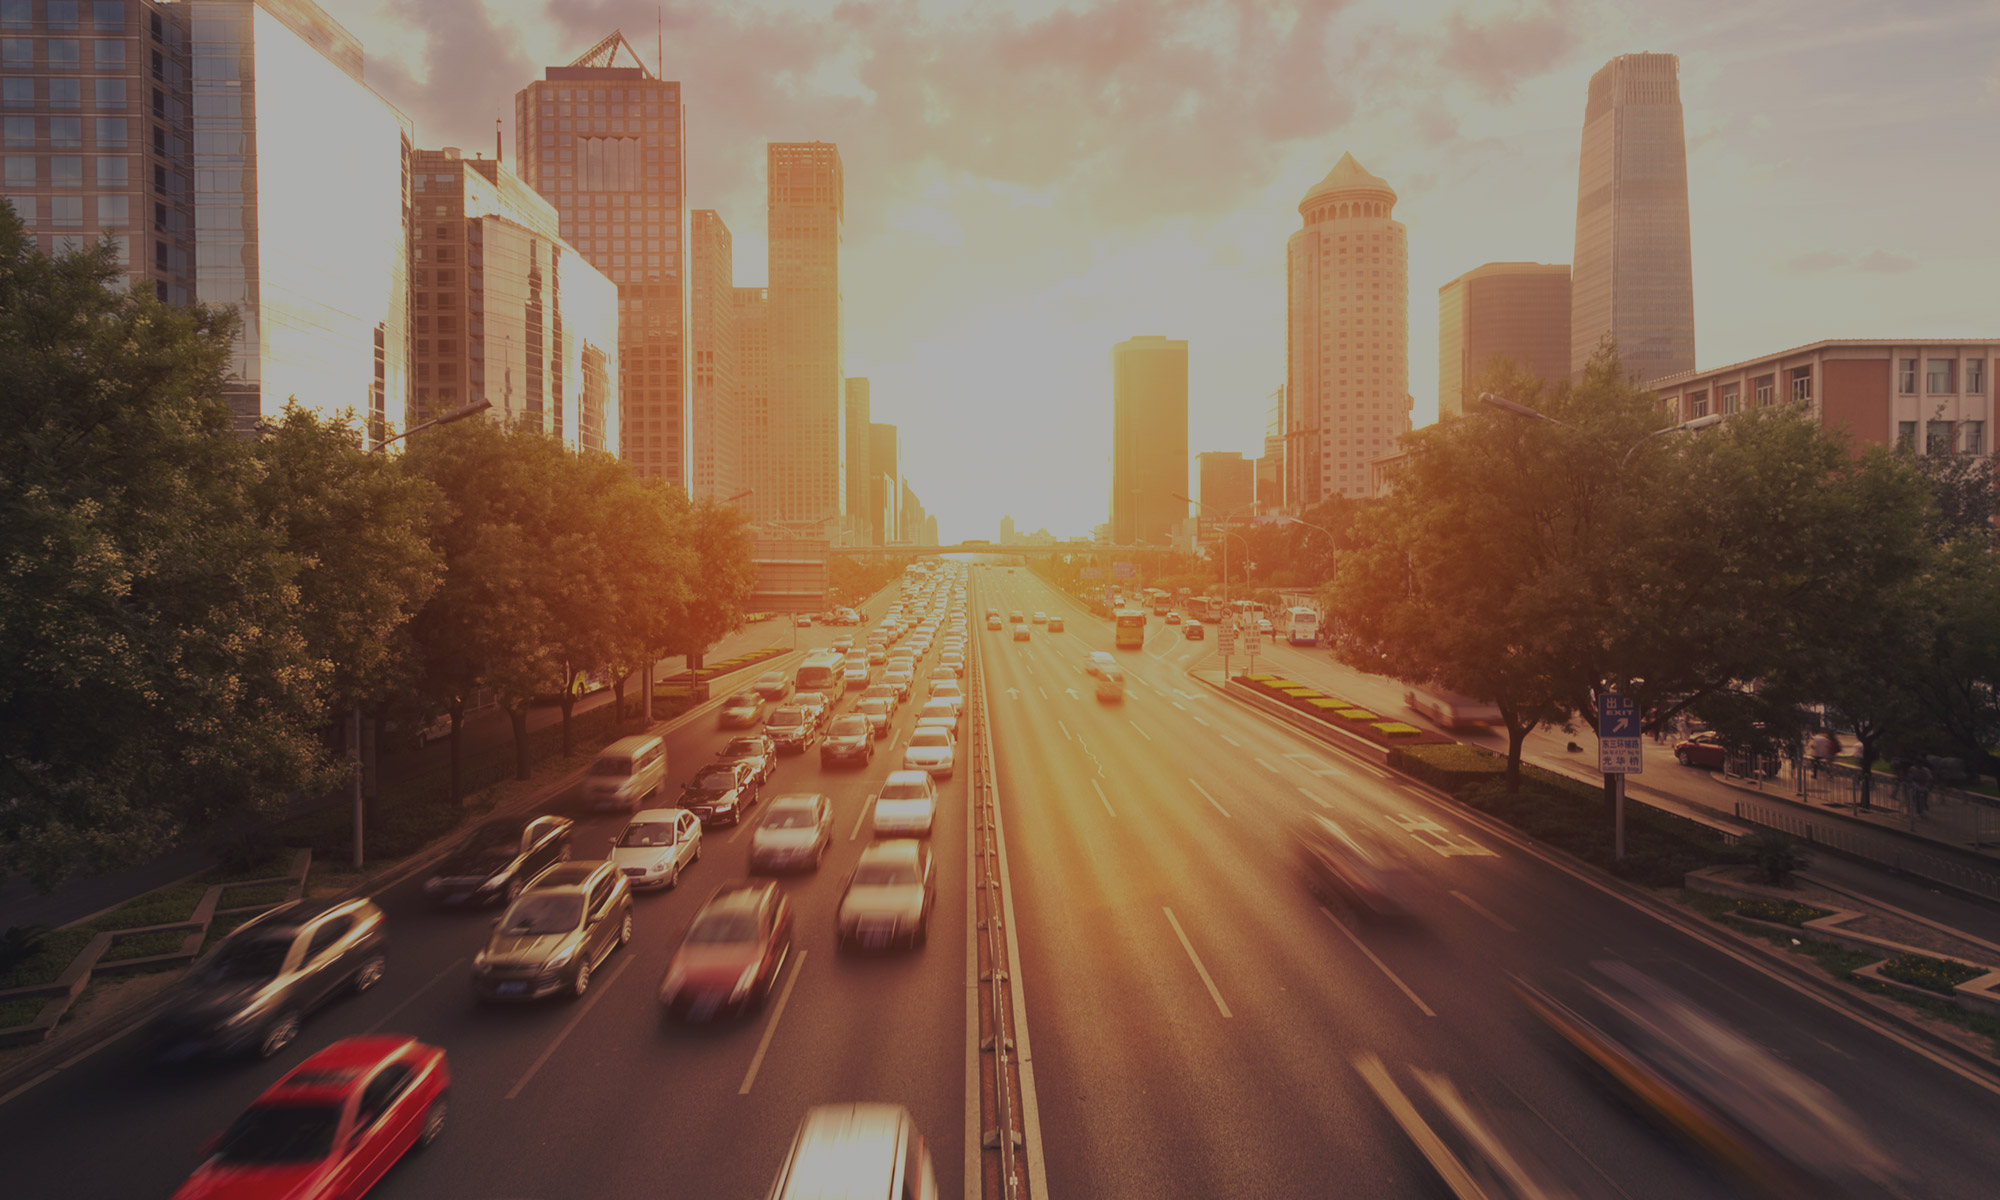
So how’s your commute? Next week we’ll publish our 6th Annual INRIX Traffic Scorecard Report where we’ll reveal the worst traffic cities, roads and amount of delay drivers experienced last year.
Since the first publication in 2007, the INRIX National Traffic Scorecard Report has analyzed and compared the status of traffic congestion in countries and major metropolitan areas worldwide. Used by regional departments of transportation, academics, the media, city planners, economists and everyday drivers, the INRIX Scorecard has become a trusted benchmark for understanding congestion and its impact in our daily lives.
- In this year’s report we’ll explore several key questions including:
- Has traffic gotten better or worse in your town in the last year? How much?
- How many hours do drivers waste every year on the worst roads?
- What does traffic say about the health of the U.S. economy and the prospects for growth in my city?
- How does your city compare to others in the national congestion rankings?
- Will traffic congestion get worse in 2014? Is there anything we can do about it?
The results are surprising, but regardless, we know one thing for sure – as much as traffic congestion trends can provide us with a barometer of the health of our economies, it is also a drain on economic growth as the billions of dollars wasted on gas in traffic is money not spent elsewhere in the economy. This is compounded by the fact that impacts of traffic congestion on the manufacturers and distributors of goods and services gets passed on in the form of higher prices on our daily purchases.
The good news is the same data we use to create the Scorecard report is opening up new avenues for the industry and government to tackle this intractable problem. Increasingly, the vehicles we drive and the mobile devices we carry have the ability to help us avoid gridlock by crowd-sourcing drivers contributing location, direction and speed to the network. In aggregate this information, it can be used to help drivers always know the best route, fastest travel time and expected arrival from all possible roads and routes.
Take our departments of transportation, for example, they are using this robust, real-time data to build intelligence into America’s transportation networks with the goal of routing people and commerce across our roads as efficiently as we move data across today’s IT networks.
In short, no matter how painful a picture the Scorecard paints next week, we have new tools at our disposal in the form of massive amounts of real-time traffic data from connected cars to mobile devices that can be used to deliver services like our INRIX Traffic app designed to help reduce the time, money and fuel you waste frustrated in gridlock.
We invite you to join us next week as we take a brief trip back in time to examine the impact of traffic congestion on our lives and explore what it means to minimize traffic’s impact on the future of our lives, economies and planet.
Onward,
Jim Bak
Author
INRIX Traffic Scorecard Annual Report


