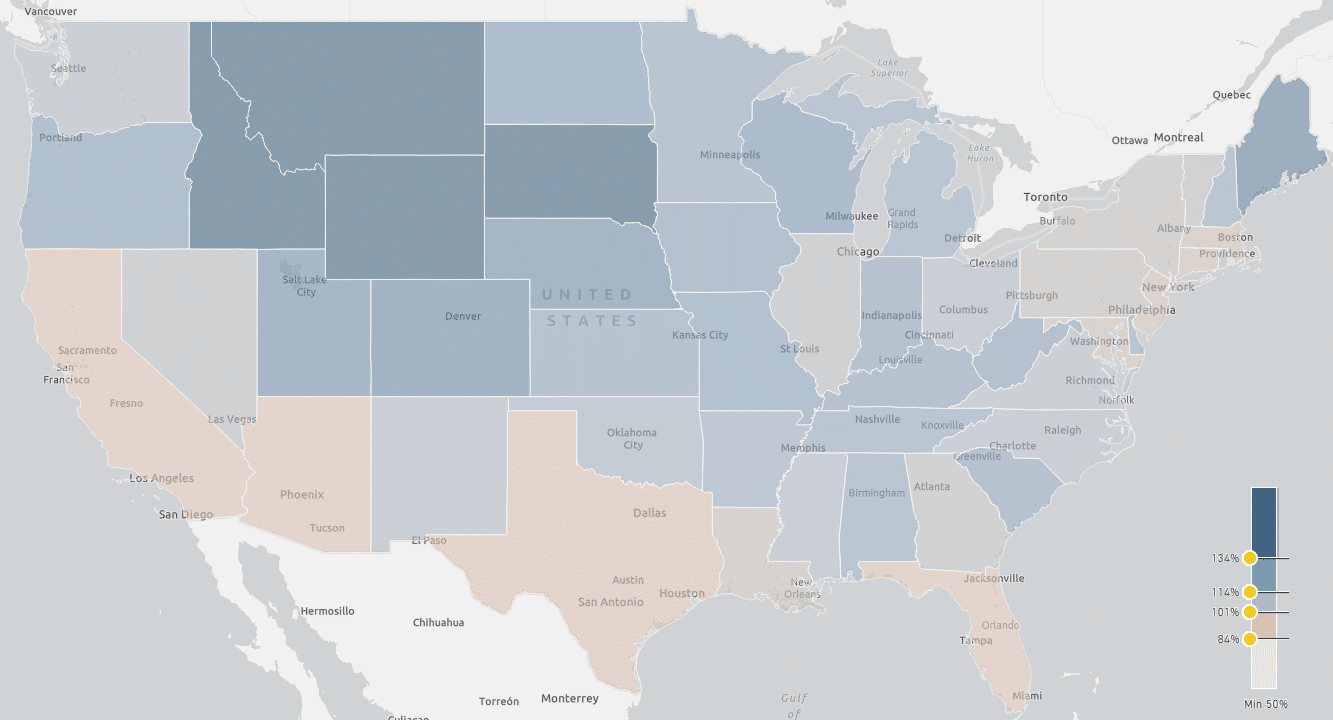


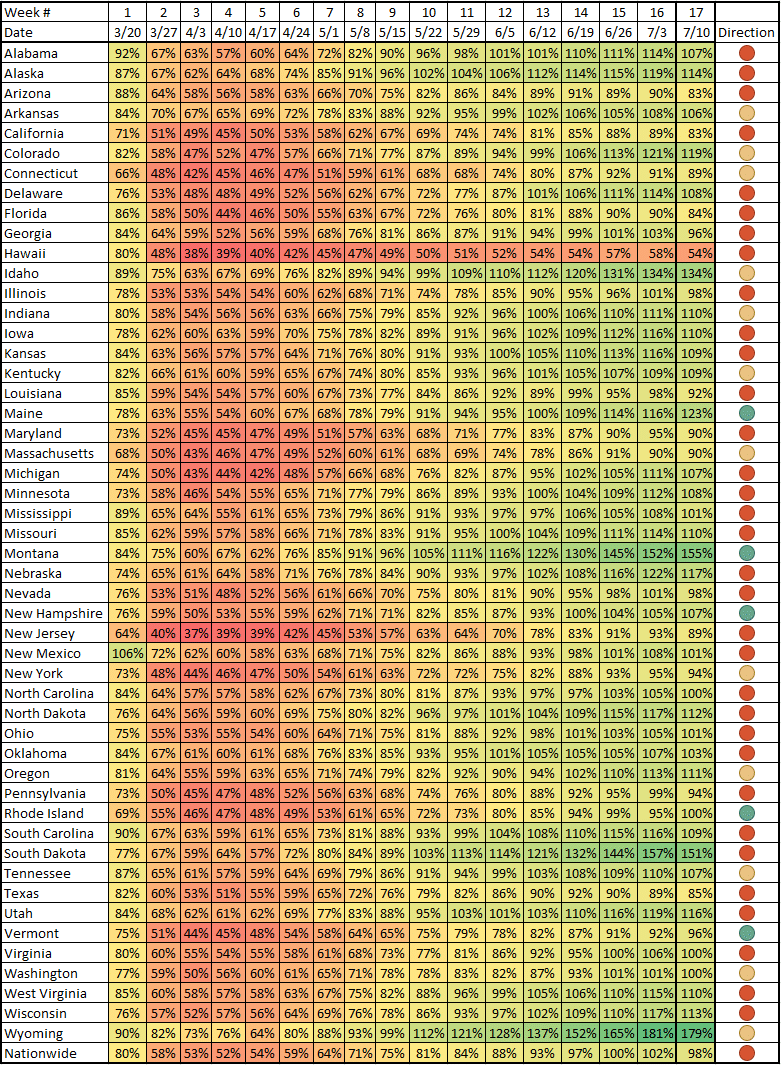
Since Rick Schuman noted in his last posting of the “INRIX U.S. National Traffic Volume” series before the holiday weekend (thanks Rick!), nationwide passenger travel has remained at its pre-COVID level, but has yet to meet its seasonally adjusted level of traffic. With COVID-19 lockdowns still in effect in most states and local jurisdictions, with some places rolling back or halting plans to move ahead to the next phase, we will begin to shift focus on Metropolitan Statistical Areas versus nationwide statistics, which will post regularly on Tuesdays.
That being said, since the Fourth of July was observed on a Friday, weekend travel was down overall in a large majority of states, as VMT grew in just five states. Nationwide VMT also backtracked about four percent from Week 16.
Metro Areas
Though 31 out of 50 states have met or surpassed their pre-COVID level of VMT, a rate of 62%, just 26% of Metro Areas analyzed have reached their target. Judging by “Bottom 10 Metro Areas” below, density, COVID testing, and a lack of activity around downtown cores are likely to be major factors,
| Top 10 Metro Areas – VMT | Bottom 10 Metro Areas – VMT | |||
| Mobile AL | 135% | Miami FL | 67% | |
| Knoxville TN | 124% | Honolulu HI | 68% | |
| Pensacola-Ferry Pass-Brent FL | 121% | McAllen-Edinburg-Mission TX | 69% | |
| Portland-South Portland-Biddef ME | 119% | Orlando FL | 71% | |
| Colorado Springs CO | 115% | San Francisco CA | 72% | |
| Spokane WA | 113% | Phoenix AZ | 72% | |
| Hampton Roads VA | 111% | Tucson AZ | 75% | |
| Chattanooga TN-GA | 111% | Lakeland FL | 76% | |
| Toledo OH | 111% | Austin TX | 78% | |
| Lexington-Fayette KY | 109% | Los Angeles CA | 78% | |
INRIX will take a much more in-depth look at interesting findings around Metropolitan Areas in our Tuesday analysis. SUBSCRIBE BELOW!