


When it comes to understanding speed, transportation professionals need more than averages. To design safer streets, prioritize investments, and evaluate policy, agencies must understand how fast people are actually driving—when, where, and by how much.
Today, we’re excited to launch the INRIX Speed Distribution Profiles API: a new way to access hourly, direction-specific distributions of observed speeds for road segments across your network.
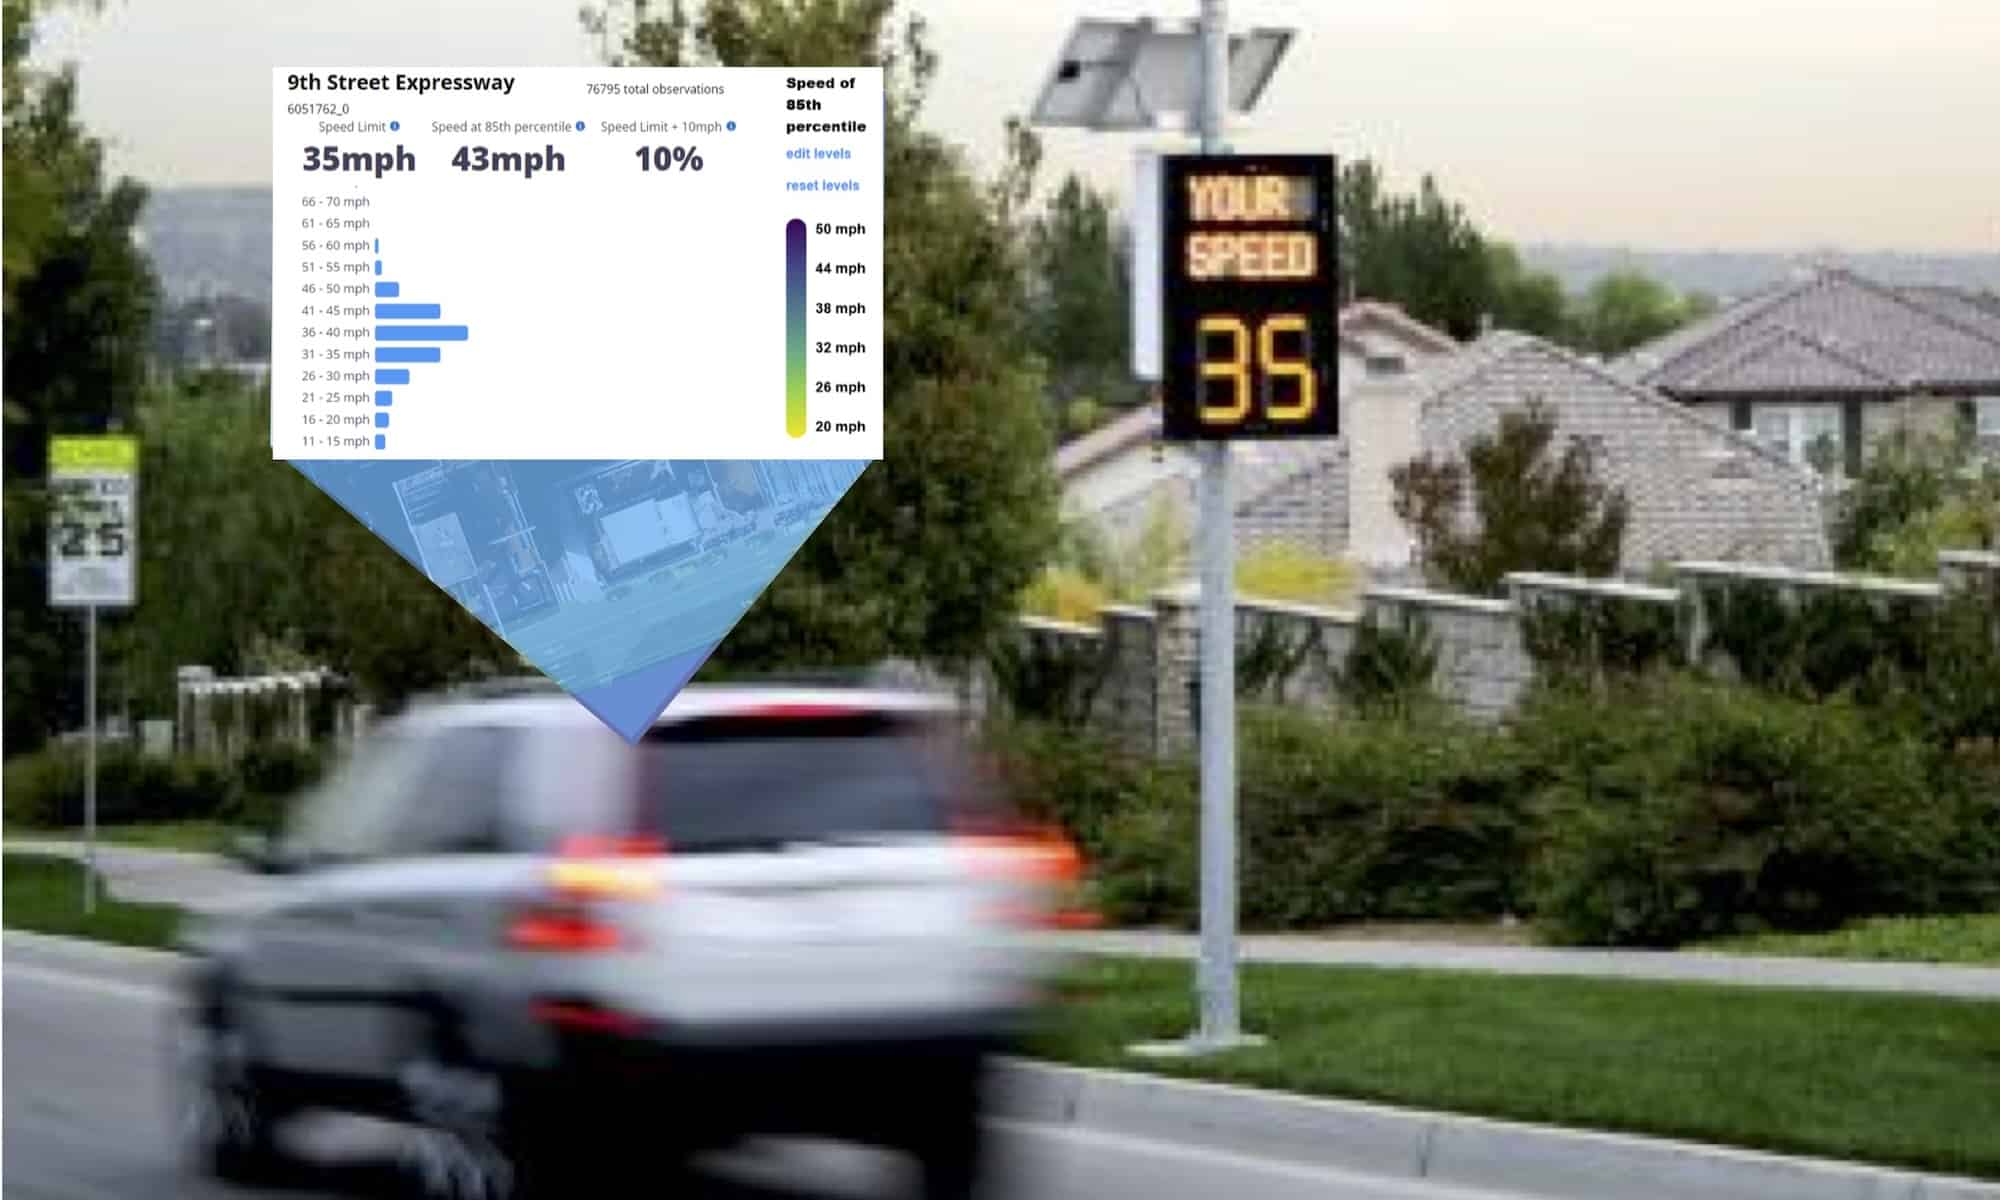
Unlike spot studies or one-off field counts, Speed Distribution Profiles reveal the full shape of speed behavior—including percentile speeds and the share of vehicles above risk thresholds—so you can identify systemic speeding, target interventions, and quantify impact without deploying equipment or doing field work.
How the INRIX Speed Distribution Profiles API Can Help
Averages hide risky “tails.” Our Speed Distribution Profiles API goes beyond simple calculations or modeled outputs by delivering hourly, direction-specific speed distributions (in 5-mph bins), percentile speeds (e.g., median, 85th), and threshold-exceedance rates. That means you see how many drivers are speeding and by how much—the detail planners need to act. Because it’s an API, you can plug these outputs directly into your GIS, dashboards, and workflows to automate hotspot detection, prioritize projects, and make faster, data-driven decisions.
With INRIX Speed Distribution Profiles, agencies can:
- Pinpoint speeding hotspots by hour, direction, and segment—before crashes happen
- Prioritize corridors where high-end speeding is common (e.g., 85th > safe threshold)
- Evaluate policy and project impact using before/after speed comparisons
- Target the right times & directions using hourly, direction-specific results to reveal PM peaks, school-dismissal spikes, downhill patterns, and weekend surges.
- Align enforcement and education to the times and places where speeding is worst
- Strengthen grants and reports with clear, defensible metrics
- Operationalize insights by feeding API outputs into your existing tools to score corridors, trigger alerts, and support enforcement or education plans
What You’ll Get
Our Speed Distribution Profiles API provides the core data planners need to understand speed behavior at the segment level and act on it. For every road segment and direction, you receive hourly speed distributions by day of week, organized in intuitive 5-mph bins (e.g., 25–30, 30–35). Each response also includes percentile speeds (median, 85th, 95th, etc.) and threshold-exceedance metrics (the share of vehicles traveling more than X mph over the posted limit). To keep results transparent and usable, we include sample sizes, segment metadata (ID, length), time indexing (hour/day), and units (mph/kph).
The Speed Distribution Profiles API delivers:
- Observed speed distributions by hour of day and day of week, for each road segment and direction
- 5 mph speed bins and percentile speeds (e.g., median, 85th)
- Threshold exceedance metrics (e.g., % > posted limit or avg. mph)
- Sample sizes and supporting metadata for confidence and transparency
All data is derived from anonymized, real-world vehicle observations and returned in clean, developer-friendly JSON for easy use in dashboards, GIS, and analytics workflows.
Developer Friendly API
Outputs arrive as clean, developer-friendly JSON with stable segment IDs, making it straightforward to join the data to your centerline, GIS, dashboards, or corridor models. Results are direction-specific and consistently timestamped for time-series work. The API supports both bulk pulls (for a network or study area) and targeted queries (for a single corridor or set of segments), so you can pull exactly what your analysis requires and drop it directly into your workflow.
Features to Fit Your Workflows
The API and insights available were built around practical planning tasks to empower transportation professionals to work smarter, and faster. INRIX turns our real-world driving observations from connected vehicles(CV data) into actionable context for everyday decisions—screening corridors for systemic speeding, pinpointing the worst hours and directions, evaluating design and policy changes with before/after evidence, and strengthening grants and reports with defensible metrics. Since it’s an API, integration is quick and because it’s based on CV data, you get consistent coverage without installing hardware. To make these use cases practical in your existing GIS, dashboards, and workflows, the API includes:
- Time-profiled insights: Hourly distributions by day of week expose peak-risk windows (AM/PM peaks, school hours, weekends).
- Directional precision: Separate northbound/southbound (or inbound/outbound) to address downhill or outbound speeding patterns.
- Flexible filtering: Filter or query by date/time, day of week, direction, segment, or corridor/area.
- Drop-in integration: Clean JSON and stable segment IDs make joins to your GIS, dashboards, and reports straightforward.
- No hardware required: Systemwide, sensorless coverage for consistent, apples-to-apples analysis.
- Ready for before/after studies: Compare two periods to quantify changes in distributions, percentiles, and exceedance rates.
Trustworthy Data Sourced from Billions of Data Points
The Speed Distribution Profiles dataset is built from billions of data points from connected vehicles, collected across urban, suburban, and rural roads—reflecting real driving behavior rather than modeled estimates.
We process those observations into hourly, direction-specific speed distributions for each segment, compute percentile speeds and threshold exceedance metrics, and return standardized JSON responses your tools can read immediately. By map-matching this data to road segments, stored by direction, and aggregated into hourly, day-of-week profiles with 5-mph bins and percentile speeds, you can easily see not just whether speeding occurs, but how many drivers are speeding and by how much.
Robust processing— including outlier filtering, consistency checks, and sample-size reporting—helps ensure stable distributions and transparent confidence. The result is a deep, defensible foundation for safety planning, targeted enforcement, policy evaluation, and before/after studies—ready to plug into your GIS, dashboards, and workflows on day one.
No sensors. No field deployments. Just actionable speed behavior at scale.
Getting started
The Speed Distribution Profiles API is available now. If you’re an INRIX customer, your account team can enable access and share documentation. New to INRIX? We’ll help you stand up a pilot, connect your network, and integrate outputs into your existing GIS and dashboards.
Contact us to get a free demo!