


Last fall, California Governor Gavin Newsome imposed Executive Order N-79-20, directing state officials to require that 100% of new passenger vehicles sold beyond 2035 be zero-emission. The Governor stated that the transportation sector is the bulk contributor to the state’s carbon pollution. At the federal level, President Joe Biden has instructed federal agencies to procure electric vehicles to replace gas-powered fleets.
The moves seek to reduce greenhouse gas emissions and improve health around polluted areas.
While those executive orders are broad-sweeping and span into the next decade, there are things local municipalities, like towns, cities and counties, can do today to limit their carbon footprint and improve air quality – re-time traffic lights.
Though not usually attention-grabbing, small changes at intersections can provide significant reductions in vehicular delay, travel times, and eliminate idling and wasted fuel. According to the recently released INRIX U.S. Signals Scorecard, nearly 7% of a trip’s delay is located at signalized intersections, leading to 17.25 million hours sitting at traffic lights in the United States every single day.
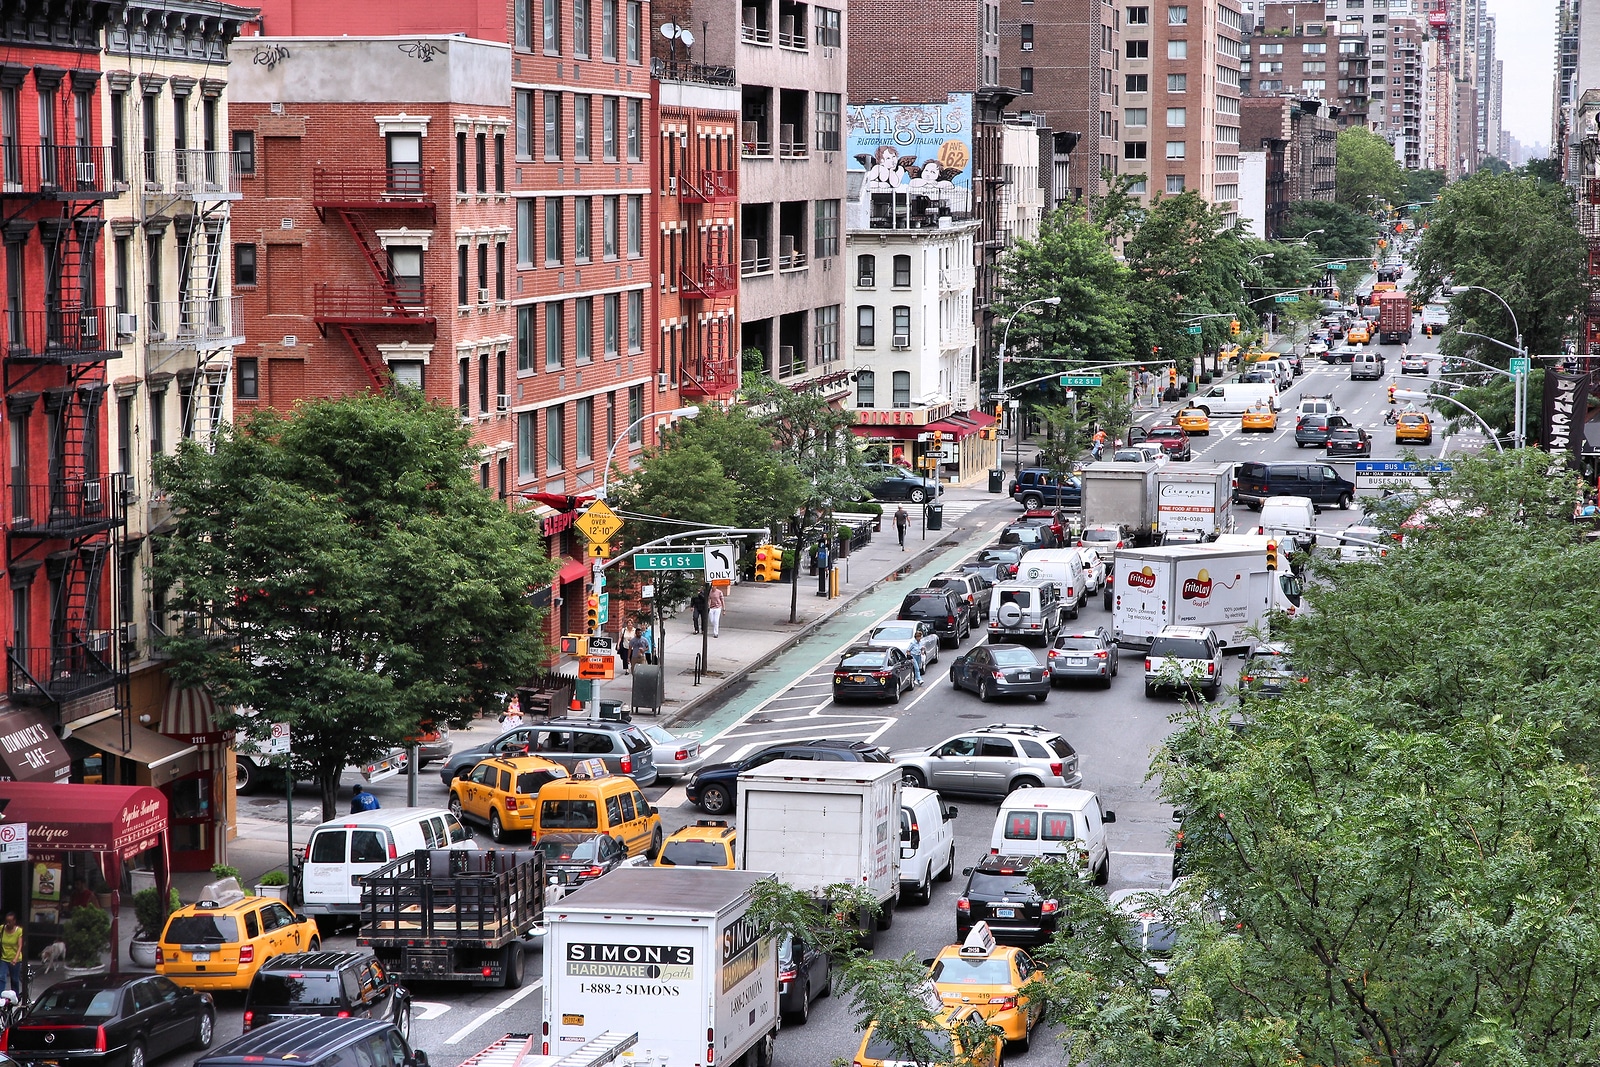
Further, this delay is concentrated in many areas, leading to direct exposure to toxic air pollutants. For example, 4 out of the top 5 counties for delay per vehicle are located in New York City, while the Los Angeles Metro region is home to more than 1.7 million hours of delay each and every day.
In addition to the Signals Scorecard, INRIX has calculated the estimated carbon emissions at the Top 25 intersections for total daily delay. We found that peak hour CO2 emissions varied considerably based on the number of stops, VMT, and total signal delay.
The Top 25 intersections reveal a range of outputs on gallons spent, carbon emissions and delay. Yet at all but one intersection, the majority of drivers see red when reaching an intersection, as Arrival On Green percentages. At West Flamingo Road & South Las Vegas Boulevard, #1 in total daily delay, we see drivers burn 419 gallons per day, driving, crossing, stopping, idling and accelerating across the intersection,[1] emitting 3.7 tonnes of CO2e into the atmosphere. To put this in perspective, this is the equivalent to more than 60% of one home’s annual energy use, during the daily peak hour, at one intersection.
| Rank | County | State | Intersection | Total Daily Delay (Hours) | Arrival on Green (%) | Gallons Used Peak Hour | CO2e Tonnes per daily peak hour |
| 1 | Clark | NV | West Flamingo Road & South Las Vegas Boulevard | 1658 | 28% | 419 | 3.7 |
| 2 | Clark | NV | Sands Avenue & South Las Vegas Boulevard | 1455 | 22% | 258 | 2.3 |
| 3 | Pasco | FL | Land O’ Lakes Boulevard & FL 54 | 1298 | 28% | 195 | 1.7 |
| 4 | Los Angeles | CA | Newhall Ranch Road & Bouquet Canyon Road | 1260 | 36% | 404 | 3.5 |
| 5 | Miami-Dade | FL | Southwest 152nd Street & Southwest 137th Avenue | 1219 | 31% | 212 | 1.9 |
| 6 | Clark | NV | West Tropicana Avenue & South Las Vegas Boulevard | 1206 | 36% | 393 | 3.4 |
| 7 | Charles | MD | Leonardtown Road & Crain Highway | 1154 | 36% | 256 | 2.2 |
| 8 | Orange | CA | Newport Boulevard & West 19th Street | 1142 | 48% | 410 | 3.6 |
| 9 | El Paso | CO | North Academy Boulevard & Austin Bluffs Parkway | 1140 | 26% | 399 | 3.5 |
| 10 | Hillsborough | FL | Gibsonton Drive & US 301 | 1092 | 33% | 208 | 1.8 |
| 11 | Kings | NY | Atlantic Avenue & 4th Avenue | 1086 | 46% | 291 | 2.6 |
| 12 | Clark | NV | North Lamb Boulevard & East Charleston Boulevard | 1081 | 21% | 146 | 1.3 |
| 13 | Riverside | CA | Winchester Road & Ynez Road | 1081 | 34% | 352 | 3.1 |
| 14 | Lee | FL | Santa Barbara Boulevard & Veterans Memorial Parkway | 1061 | 38% | 213 | 1.9 |
| 15 | New Castle | DE | Frenchtown Road | 1060 | 33% | 222 | 1.9 |
| 16 | Okaloosa | FL | Emerald Coast Parkway & Hutchinson Street | 1051 | 50% | 285 | 2.5 |
| 17 | Broward | FL | Federal Highway & East Commercial Boulevard | 1049 | 29% | 185 | 1.6 |
| 18 | Nassau | NY | Long Beach Boulevard & East Park Avenue | 1046 | 28% | 414 | 3.6 |
| 19 | Montgomery | TX | FM 1488 & Honea Egypt Road | 1036 | 32% | 240 | 2.1 |
| 20 | Miami-Dade | FL | Southwest 117th Avenue & Southwest 152nd Street | 1025 | 34% | 208 | 1.8 |
| 21 | Clark | NV | West Sahara Avenue & South Las Vegas Boulevard | 1018 | 35% | 291 | 2.5 |
| 22 | Orange | CA | Edinger Avenue & Beach Boulevard | 1011 | 46% | 363 | 3.2 |
| 23 | Los Angeles | CA | Valencia Boulevard & Bouquet Canyon Road | 1006 | 33% | 308 | 2.7 |
| 24 | Orange | CA | Newport Boulevard & East 17th Street | 993 | 42% | 394 | 3.4 |
| 25 | Los Angeles | CA | Firestone Boulevard & Garfield Avenue | 993 | 30% | 258 | 2.3 |
Conservatively, if we assume that coordinated signal timing can increase travel speeds by 10% (and reduce stops by 10%, this would reduce gasoline and carbon emissions by approximately 5%, reducing gasoline use at the top 25 intersections by more than 80,000 gallons per year.
If even half of the 327,000 traffic signals in the U.S. benefited from such a retiming, drivers, and the environment, would be better off. Given the high cost-benefit of signal timing projects, cited by the Institute of Transportation Engineers of being between 20:1 and 55:1,[2] systematic retiming is one key tool in the transportation toolbox to reduce delays and carbon emissions years before electric vehicles take prominence on our road network.
[1] This calculation uses Synchro 6 Emissions Calculation, “F = TotalTravel * k1 + TotalDelay * k2 + Stops * k3,” cited by NACTO, here https://nacto.org/docs/usdg/nchrp409_traffic_signal_retiming.pdf.
[2] “2012 National Traffic Signal Report Card, Technical Report,” page 4, at https://www.ite.org/pub/?id=e265477a-2354-d714-5147-870dfac0e294.