


Measuring the quality of traffic information is easy, right? If you are sitting still then the traffic display should be red and if you are zooming along with the top down then the traffic display should be green.
But wait: you could be sitting still and the lane next to you is moving, so how should the traffic speed be reported then? Or you zoom along but come to a halt at a train crossing – again it is less obvious what the display colour should be given that the next person to drive the road is unlikely to experience the same conditions.
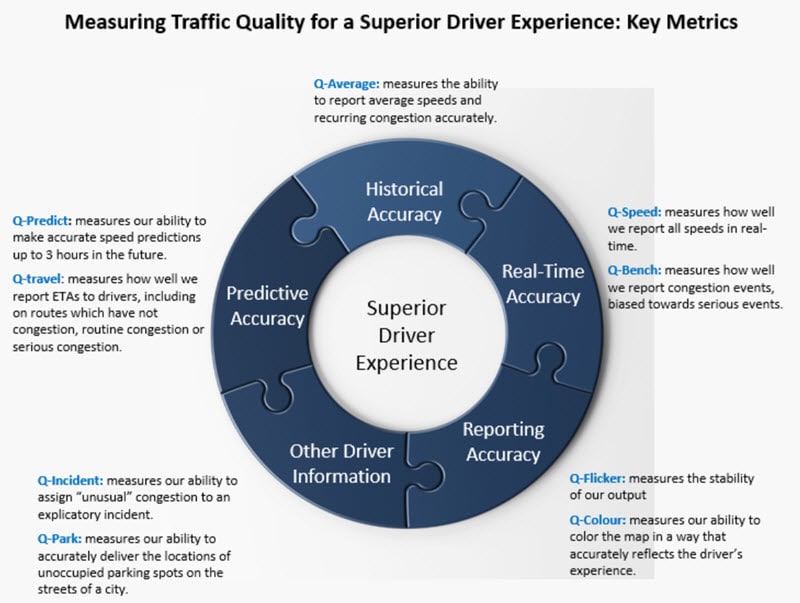
Delivering a Superior Driving Experience
INRIX takes these questions very seriously and have developed a range of measures to ensure we deliver the best possible traffic service to drivers. Each of these metrics is named with “Q” as a prefix to emphasize our focus on quality. And, these measures are targeted at each component required for delivering highly accurate traffic information as well as a superior driver experience:
- Historical Accuracy: Important for distinguishing genuine congestion events from other slowdowns that occur on road networks. It also provides a fundamental long-term speed prediction for all roads.
- Real-Time Accuracy: Vital in reporting current traffic conditions to drivers. INRIX uses two metrics to measure real-time accuracy: One assesses the accuracy across all speed bands, and the other measures accuracy of reporting speeds under congested conditions.
- Predictive Accuracy: Increasing important because it covers the state of the road between what is happening now and what will be happening at the time a driver arrives at the section of road.
- Reporting Accuracy: Often overlooked, this metric is key to delivering a positive driver’s experience. We measure reporting accuracy in two ways: First, how stable the output is and whether or not we able to deliver a stable data set without significant variation in ETAs. Secondly, we determine how accurately we present colours on a map, determined by translating speeds into colours.
- Other Driver Information: The final set of metrics address two other very critical pieces to the driver experience. First, collecting and reporting incidents, which allows the driver to understand the ‘why’ of traffic and how it connects the ‘what’, so that the driver can take the appropriate action. Secondly, we measure how well we direct drivers to an unoccupied parking space.
Complimenting a Popular Approach
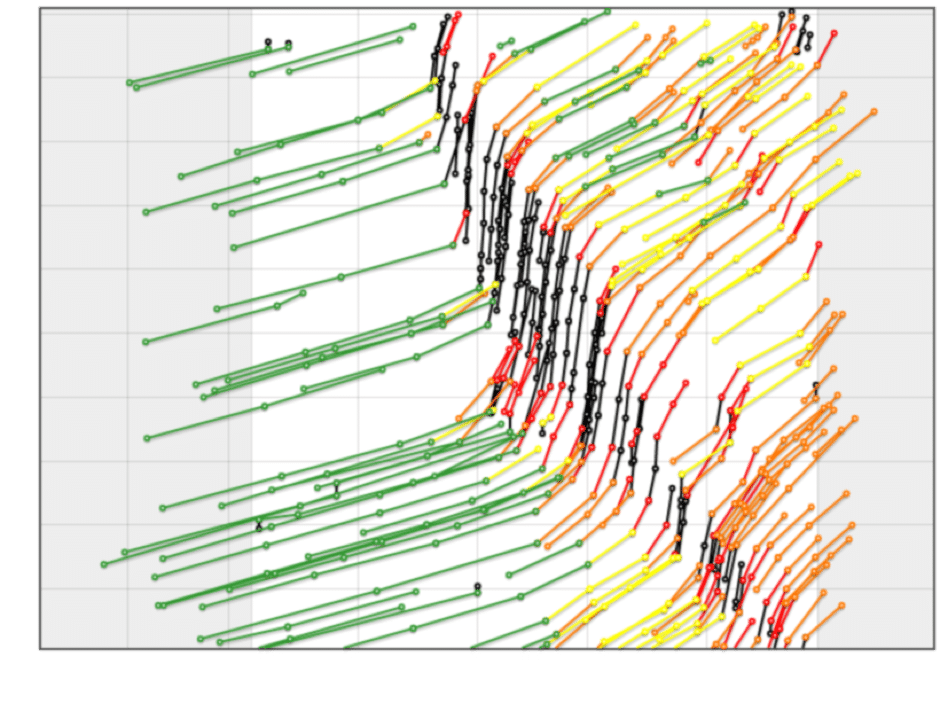
One valuable way of visualising input data is the Space Time diagram (or vapour trails in INRIX parlance) which allows a user to quickly see how much data a traffic provider has for a particular section of road at a given time. The plots give a rich set of clues to the user about not only data density but also about how a congestion event is developing over time. In truth as an analytical tool, these diagrams are incredibly useful. For example, the below illustration shows the development of a congestion event over time (on the y-axis), where each continuous line represents one vehicle as it progresses along the road (on the x-axis). The vehicles are coloured coded by speed which delivers the dramatic visual representation of the congestion event as conditions change on the road.
While these diagrams are a tremendously powerful tool, they can only be used in isolated cases – that is, a user can only examine one case at a time. That is why INRIX uses them as a precision tool to determine why our reporting of a traffic event failed to meet the high standards we set and how our algorithms could be improved to deliver even better user experiences in the future. At the same time we use the full set of metrics described above to ensure that the regular algorithmic improvements designed to drive up quality do not have unexpected local adverse effects. To put it another way, it’s important to make sure that an improvement created to solve issues in Berlin and Brussels works just as well in Milan and Athens!
A look to the future
Development of new breakthrough software relies heavily on performing robust and trustworthy metrics, particularly for the advancement of machine learning and artificial intelligence. After all, the very nature of artificial intelligence relies on the system learning what is right and what is wrong, and metrics play a pivotal role in the feedback process by telling the model where it needs to improve.