


Over the past decade, progress toward reducing fatal crashes has stalled. In the US, road fatalities have been on the rise since 2019. In May, General Motors and INRIX teamed up, combining our expertise in connected vehicle data and transportation analytics, to build a new digital solution that provides transportation professionals data-driven insights critical to making streets safer for all road users. We’re excited to announce that Safety View by GM Future Roads & INRIX is now available nationwide.
Safety View is Now Available to Help Transportation Planners Nationwide
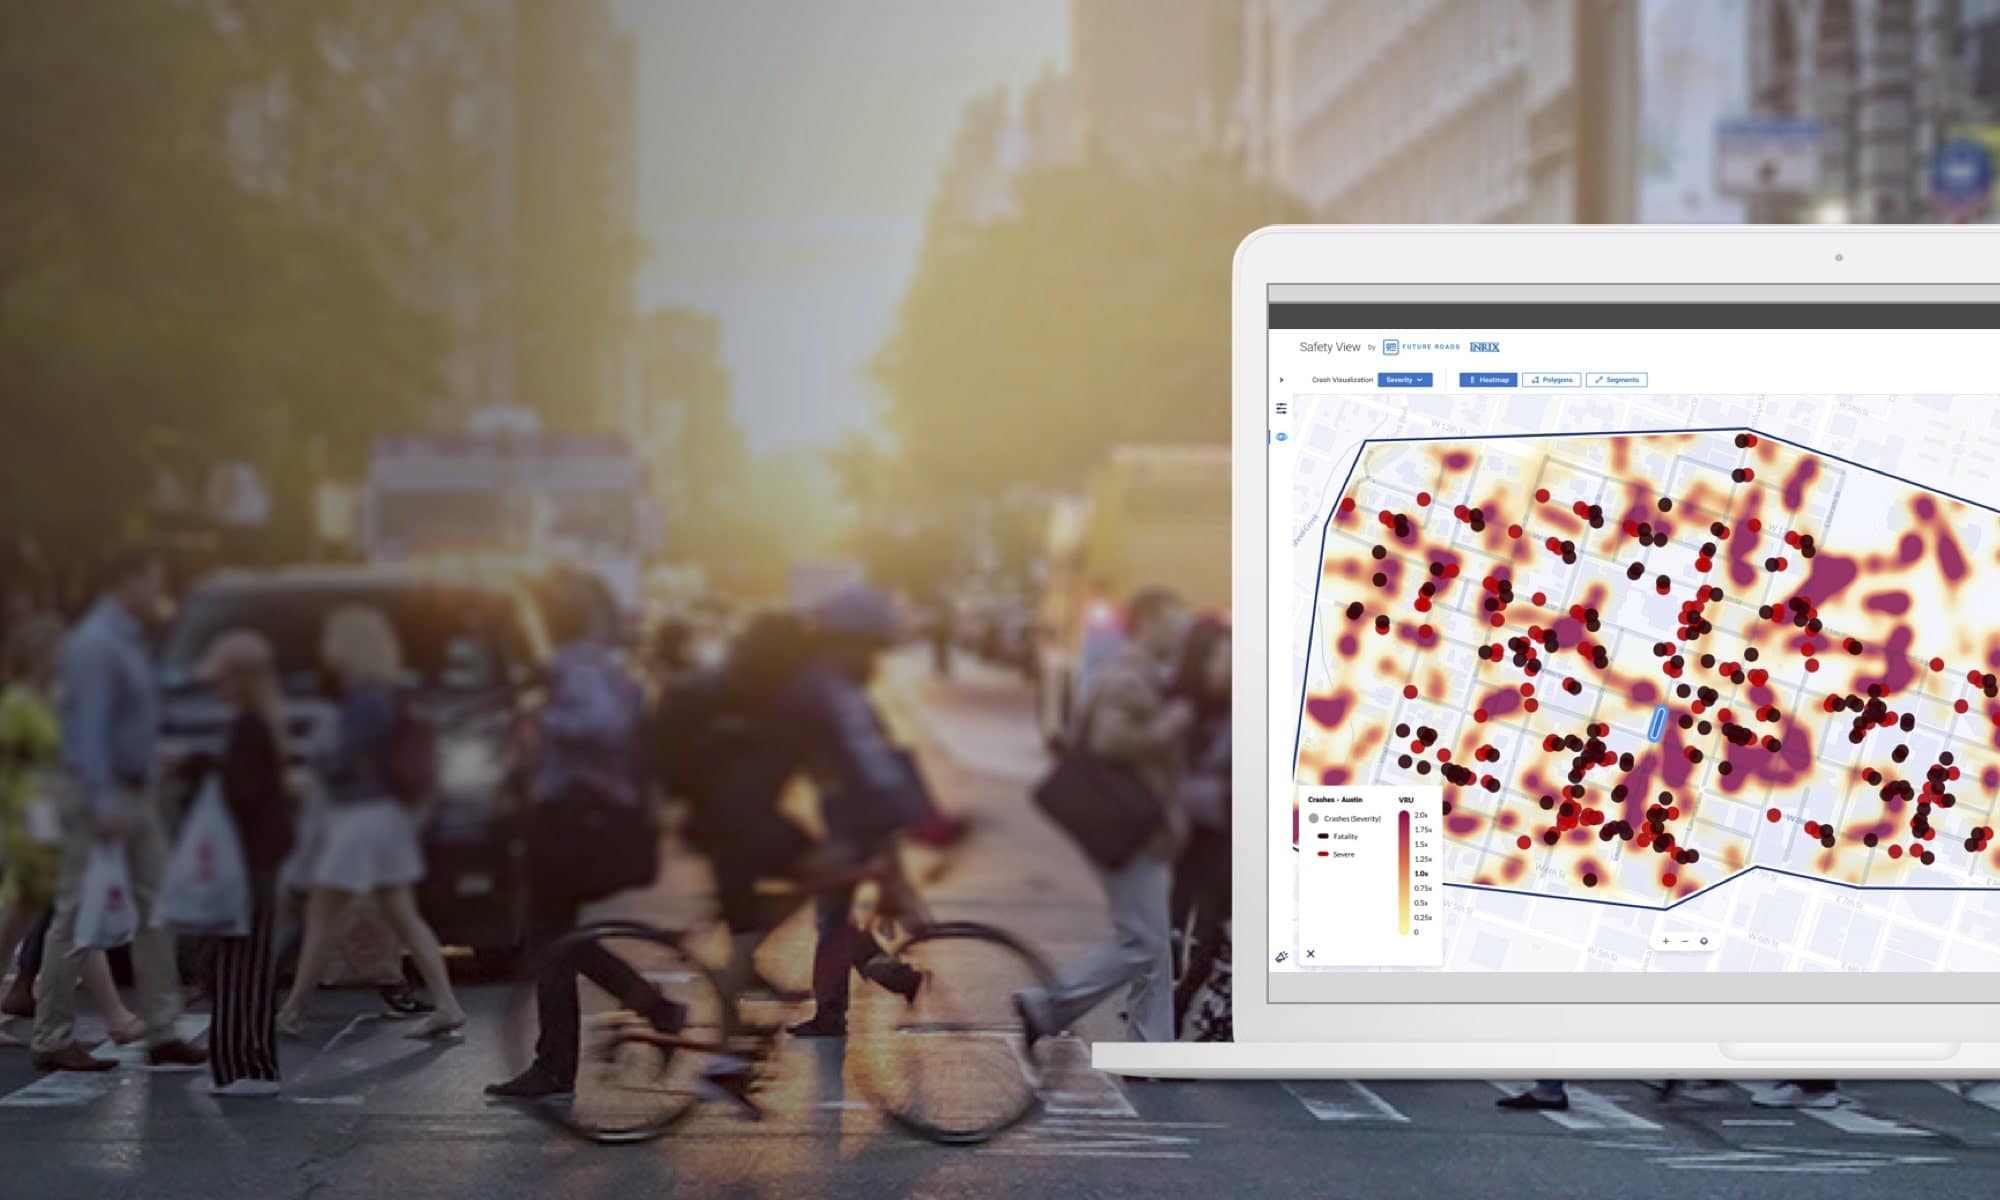
Safety View by GM Future Roads & INRIX is a cloud-based application that provides transportation officials with critical insights using crash, vehicle, vulnerable road user (VRU), and U.S. Census data, to help prioritize and measure the effectiveness of roadway safety projects and their impact on communities.
Join our product unveiling webinar to get a first-hand look at this sophisticated road safety analytics tool and learn how it can help you make an impact.
We’ll highlight key features like:
- Average Daily Volumes: Provides quarterly averaged vehicle volumes for any selected segment within your area.
- Speed Distribution Profiles: Provides information on the distribution of speeds based on percentile, speed bands, and time bins.
- VRU Data: provides the relative presence of travel for segments and areas for Vulnerable Road Users.
- Risk Score: Provides users with an at-a-glance view of risky road segments using connected vehicle data
- Seatbelt Usage: Provides users with the ability to quickly understand where drivers are not wearing seatbelts and to deploy public safety campaigns accordingly.
- Bring Your Own Crash Data: Users can import their local crash data on top of provided FARS crash data.
- Risk Analyzer: Provides users with the ability to filter pre-loaded and imported datasets to identify dangerous roads.
- Risk Explorer: Provides users with the ability to visualize pre-loaded and imported datasets on the map.
The Problem: Road Safety is Getting Worse, Especially for Vulnerable Road Users (VRUs)
Over the past decade, progress toward the goal of reducing fatal crashes has stalled. An estimated 38,680 people died in motor vehicle crashes in 2020. This is a 7.2 percent increase overall and a 23 percent increase per mile driven versus the previous year1, making each mile driven a little more dangerous. In the first half of 2021, an estimated 20,160 people died on US roadways, up 18.4 percent compared to the first six months of 20201. This disconcerting trend has disproportionally hit vulnerable road users (VRUs). Bike and pedestrian fatalities constituted 18 percent of traffic deaths in 20201. From 2010-2019, pedestrian and bicyclist fatalities increased by 45 percent while all other traffic deaths increased by 12 percent1, highlighting that the problem is getting worse, not better. With these sobering numbers in mind, the U.S. Department of Transportation, along with State and local agencies have been working hard on measures to counter this trend, including crafting, and executing Vision Zero and related plans.
The Safe Streets and Roads for All Program Provides a Unique Opportunity:
The recent passage of the $1.2 trillion Infrastructure Investment and Jobs Act (IIJA/BIL acta), includes $5B in discretionary funds for the Safe Streets and Roads for All Grant Program (SS4A) which could dramatically increase access, mobility and safety for all vulnerable road users. $2B of these funds are required to be spent on the development and execution of Vision Zero plans. This once-in-a-generation amount of funding provides a unique opportunity for public agencies all over the country to curb this devastating trend.
A key part of this program is the development of a Comprehensive Safety Action Plan, which must be in place before grant dollars can be used for implementation. And what we’ve heard from USDOT and advocates is the importance of collaborative efforts and a focus on planning process inputs – i.e., safety analysis, data-driven strategies, and equity considerations.
Central to public agencies’ success in improving road safety will be their ability to leverage new technologies to better understand, predict, and address what’s happening on the roadways. The growing fleet of connected vehicles, sophistication of onboard sensors and processing, the ubiquitous nature of connectivity, and the ability to harness the power of large mobility datasets all provide a foundation for new insights and services that can support public agencies in eliminating fatal crashes.
To learn more about the SS4A program watch our SS4A on-demand webinar.
Safety View Provides a Pathway to Help Achieve Vision Zero Goals
Safety View is a new powerful cloud-based safety analytics solution, co-developed by General Motors and INRIX, that provides comprehensive safety datasets and sophisticated analysis capabilities to help cities, counties, and Metropolitan Planning Organizations (MPOs) create more informed safety plans.
Safety View can be used in a variety of applications and analyses to better understand road safety. For example, INRIX Research leveraged Safety View to understand the efficacy of school traffic safety measures in our School Zone Traffic Safety Study. Using Safety View, we were able to analyze crash data within a quarter-mile of 27 schools in Washington D.C. to compare key metrics between streets with no school zone present and those with one at least part of the day.
Key Safety View Use Cases:
- Access Comprehensive Data: Safety View comes pre-loaded with critical safety and U.S. Census demographic datasets users need all in one easy-to-use cloud-based application and allows them to import their own crash data as well.
- Identify and Prioritize Dangerous Roadway Segments: Safety View provides sophisticated yet easy-to-use visual analysis tools like Data Explorer and Risk Analyzer that let users immediately zero in on dangerous roadway segments, gain valuable insights into what makes them so dangerous and prioritize those that need most attention.
- Evaluate the Impact of Safety Projects: The Speed, Volume, and VRU data in Safety View are updated on a quarterly basis so users don’t have to wait for the next funding cycle before exploring the impacts of the safety measures they have implemented.
- Accelerate the Funding Application Process: Safety View helps streamline the funding application by providing the required datasets and analytics tools users need all in one place, so they can easily identify areas to address, better understand the efficacy of countermeasures, and be more productive.
Interested in seeing how Safety View can help inform your Vision Zero strategy?
Request a demo from one of our experts. You can also watch our product overview webinar.
References
1: National Roadway Safety Strategy, United States Department of Transportation | January 2022