


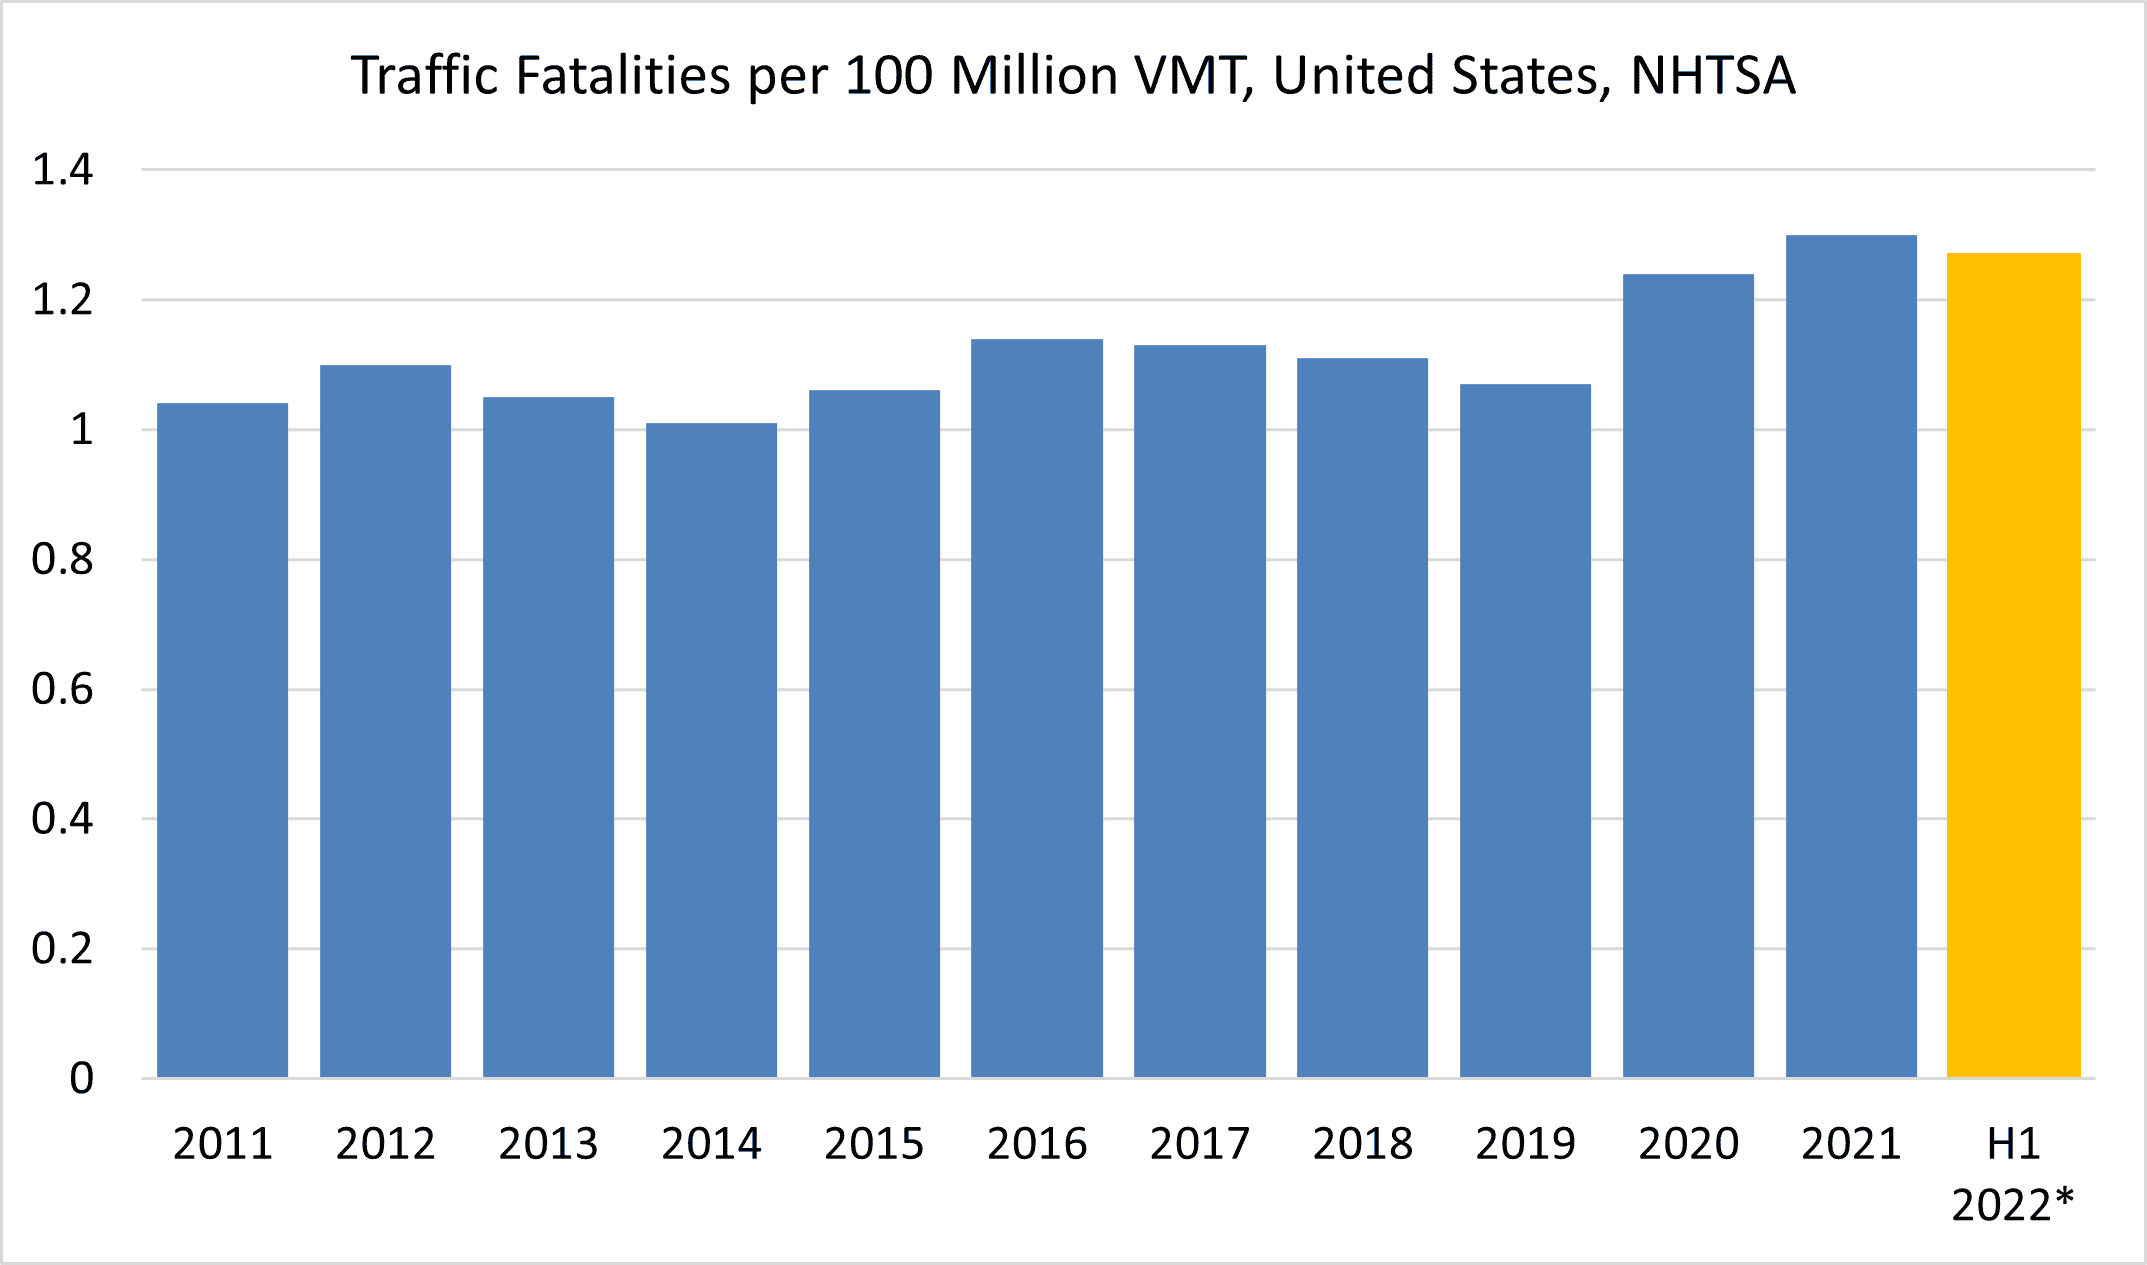
Throughout the COVID-19 pandemic, traffic fatalities and serious injuries have increased despite a drop in the amount people drive. In 2019, there was 1.07 fatalities per 100 million vehicle miles traveled (VMT) per the National Highway Traffic Safety Administration (NHTSA). Through the first half of 2022, that increased to 1.27 fatalities per 100 million VMT, a 19% increase.
Figure 1: Traffic Fatality Rate, 2011-Present, NHTSA
In the 2020 report. “COVID-19 Effect on Collisions on Interstates and Highways in the US,” INRIX Research found that travel speeds significantly increased on interstates and arterials while vehicle-miles traveled dropped. While congestion has returned to many roads, many city streets are still seeing significantly less congestion. Per the INRIX Traffic Scorecard, last mile speeds in U.S. cities increased 17% between 2019 and 2021. Faster travel speeds may exacerbate injuries when a collision occurs.
That’s why governments have worked to reduce both the number and the severity of collisions. By identifying potentially problem intersections, transportation and safety professionals can specifically target key intersections that may pose a safety risk to the traveling public.
Methodology
Signals Data: INRIX Signal Analytics provides key metrics like arrival on green, split failures, volumes and control delay on more than 240,000 traffic signals across the United States. For this analysis, INRIX used data on 7,125 traffic signals across Chicago, Dallas, Los Angeles, Seattle and Washington D.C. to determine traffic volumes during the following periods:
- October 4-10, 2020
- December 13-19, 2021
- March 7-20, 2022
- June 13-26, 2022
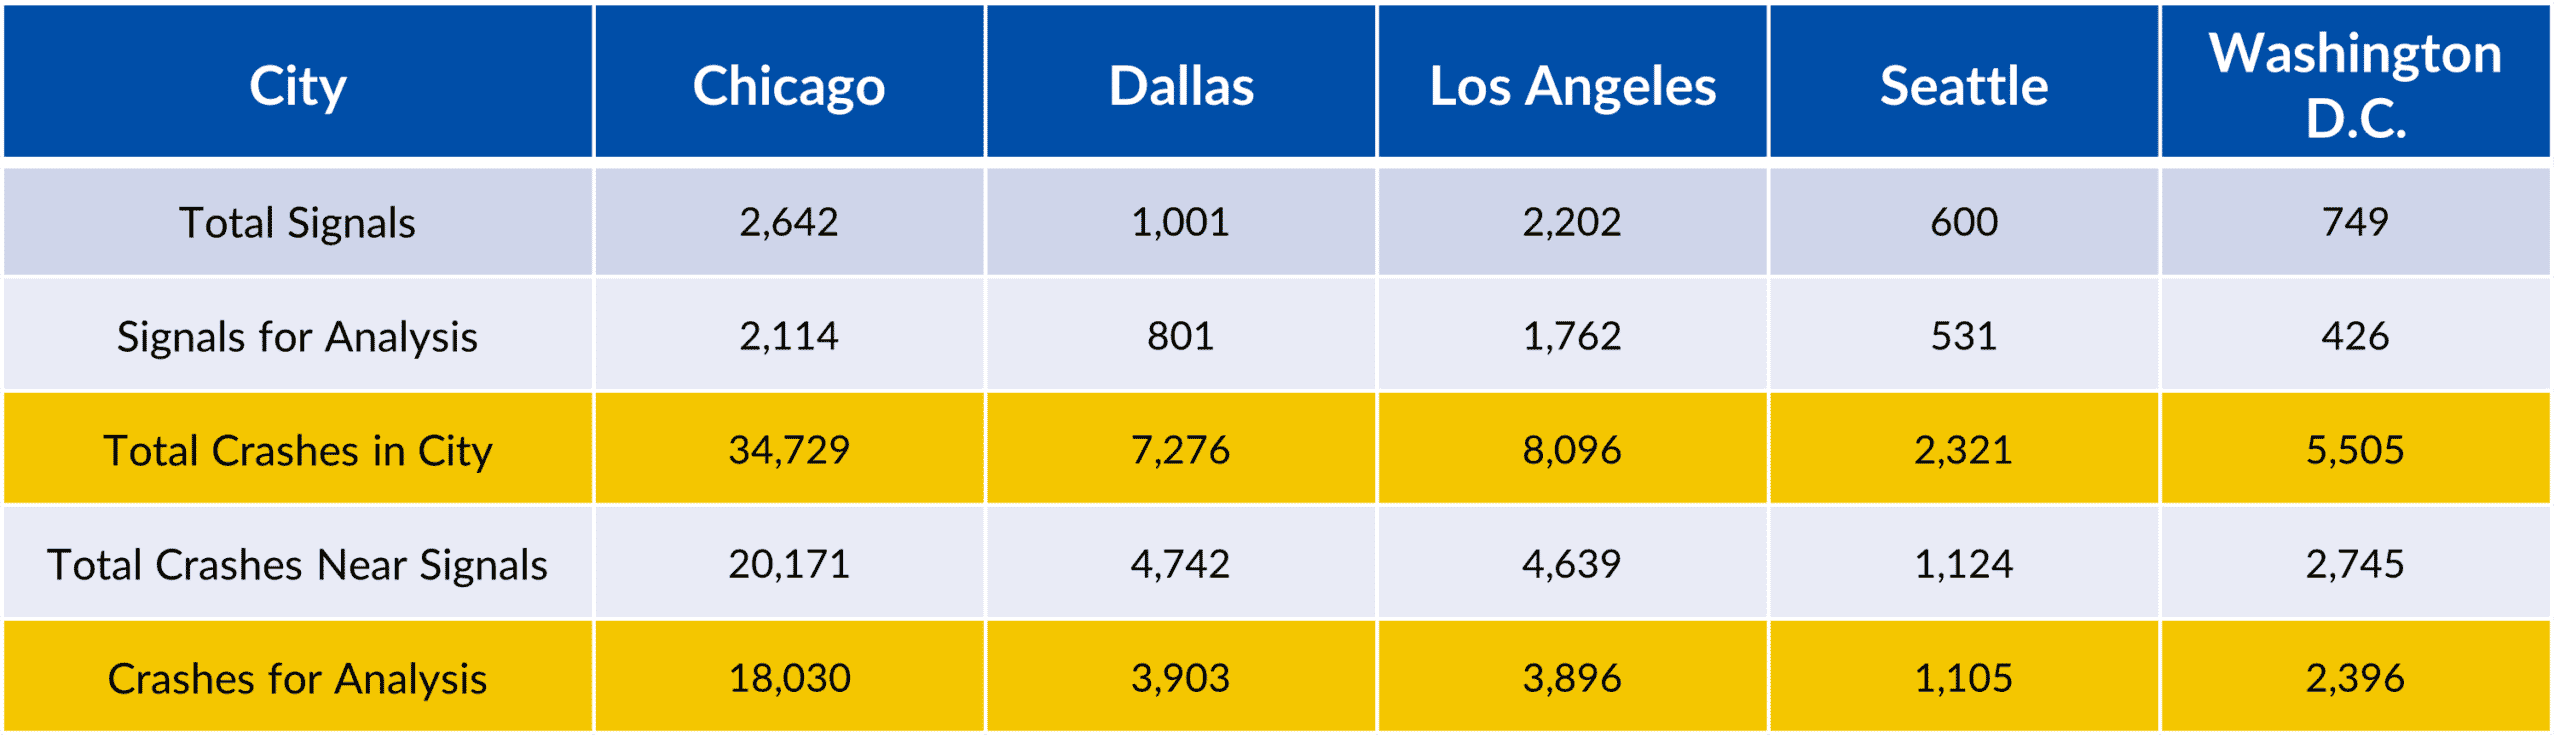
These sample volumes were then scaled to a monthly total to be paired with local crash data. To eliminate variation, the lowest-volume quintile of signals was removed from the analysis. A full count of signals analyzed is provided in Figure 2 below.
Safety Data: INRIX downloaded publicly available crash data from each of the five cities analyzed for the months of October 2020, December 2021, March and June 2022. The number of total crashes and crashes near signals are provided in Figure 2 below.
Processing: Signal and crash locations were then loaded into Geographical Information Systems software to match crash locations to signals. Crashes residing more than 400 feet from an intersection were removed from the analysis. Individual crash locations were then paired to the nearest signal, and only one match could be made. Figure 2 reveals the total number of signals and crashes in each city that moved forward in the analysis, indicated by the amber band.
Figure 2: Study Inputs
Crash Rate: The crash rate was determined by diving the number of crashes by monthly traffic volume. To provide an easier-to-read number, it was then multiplied by 100,000, to give an overall crash rate per 100,000 vehicle estimated volume.
Challenges: Due to differences in reporting and data collection efforts, comparing crash rates between cities, like comparing intersections in Washington D.C. to intersections in Seattle, is not advised.
In addition, some cities offer information that others do not, like whether the crash is related to the intersection or mid-block. For this analysis, we chose to move forward with the 400-foot limit, though a more in-depth analysis could determine the degree the intersection played a role in a particular crash.
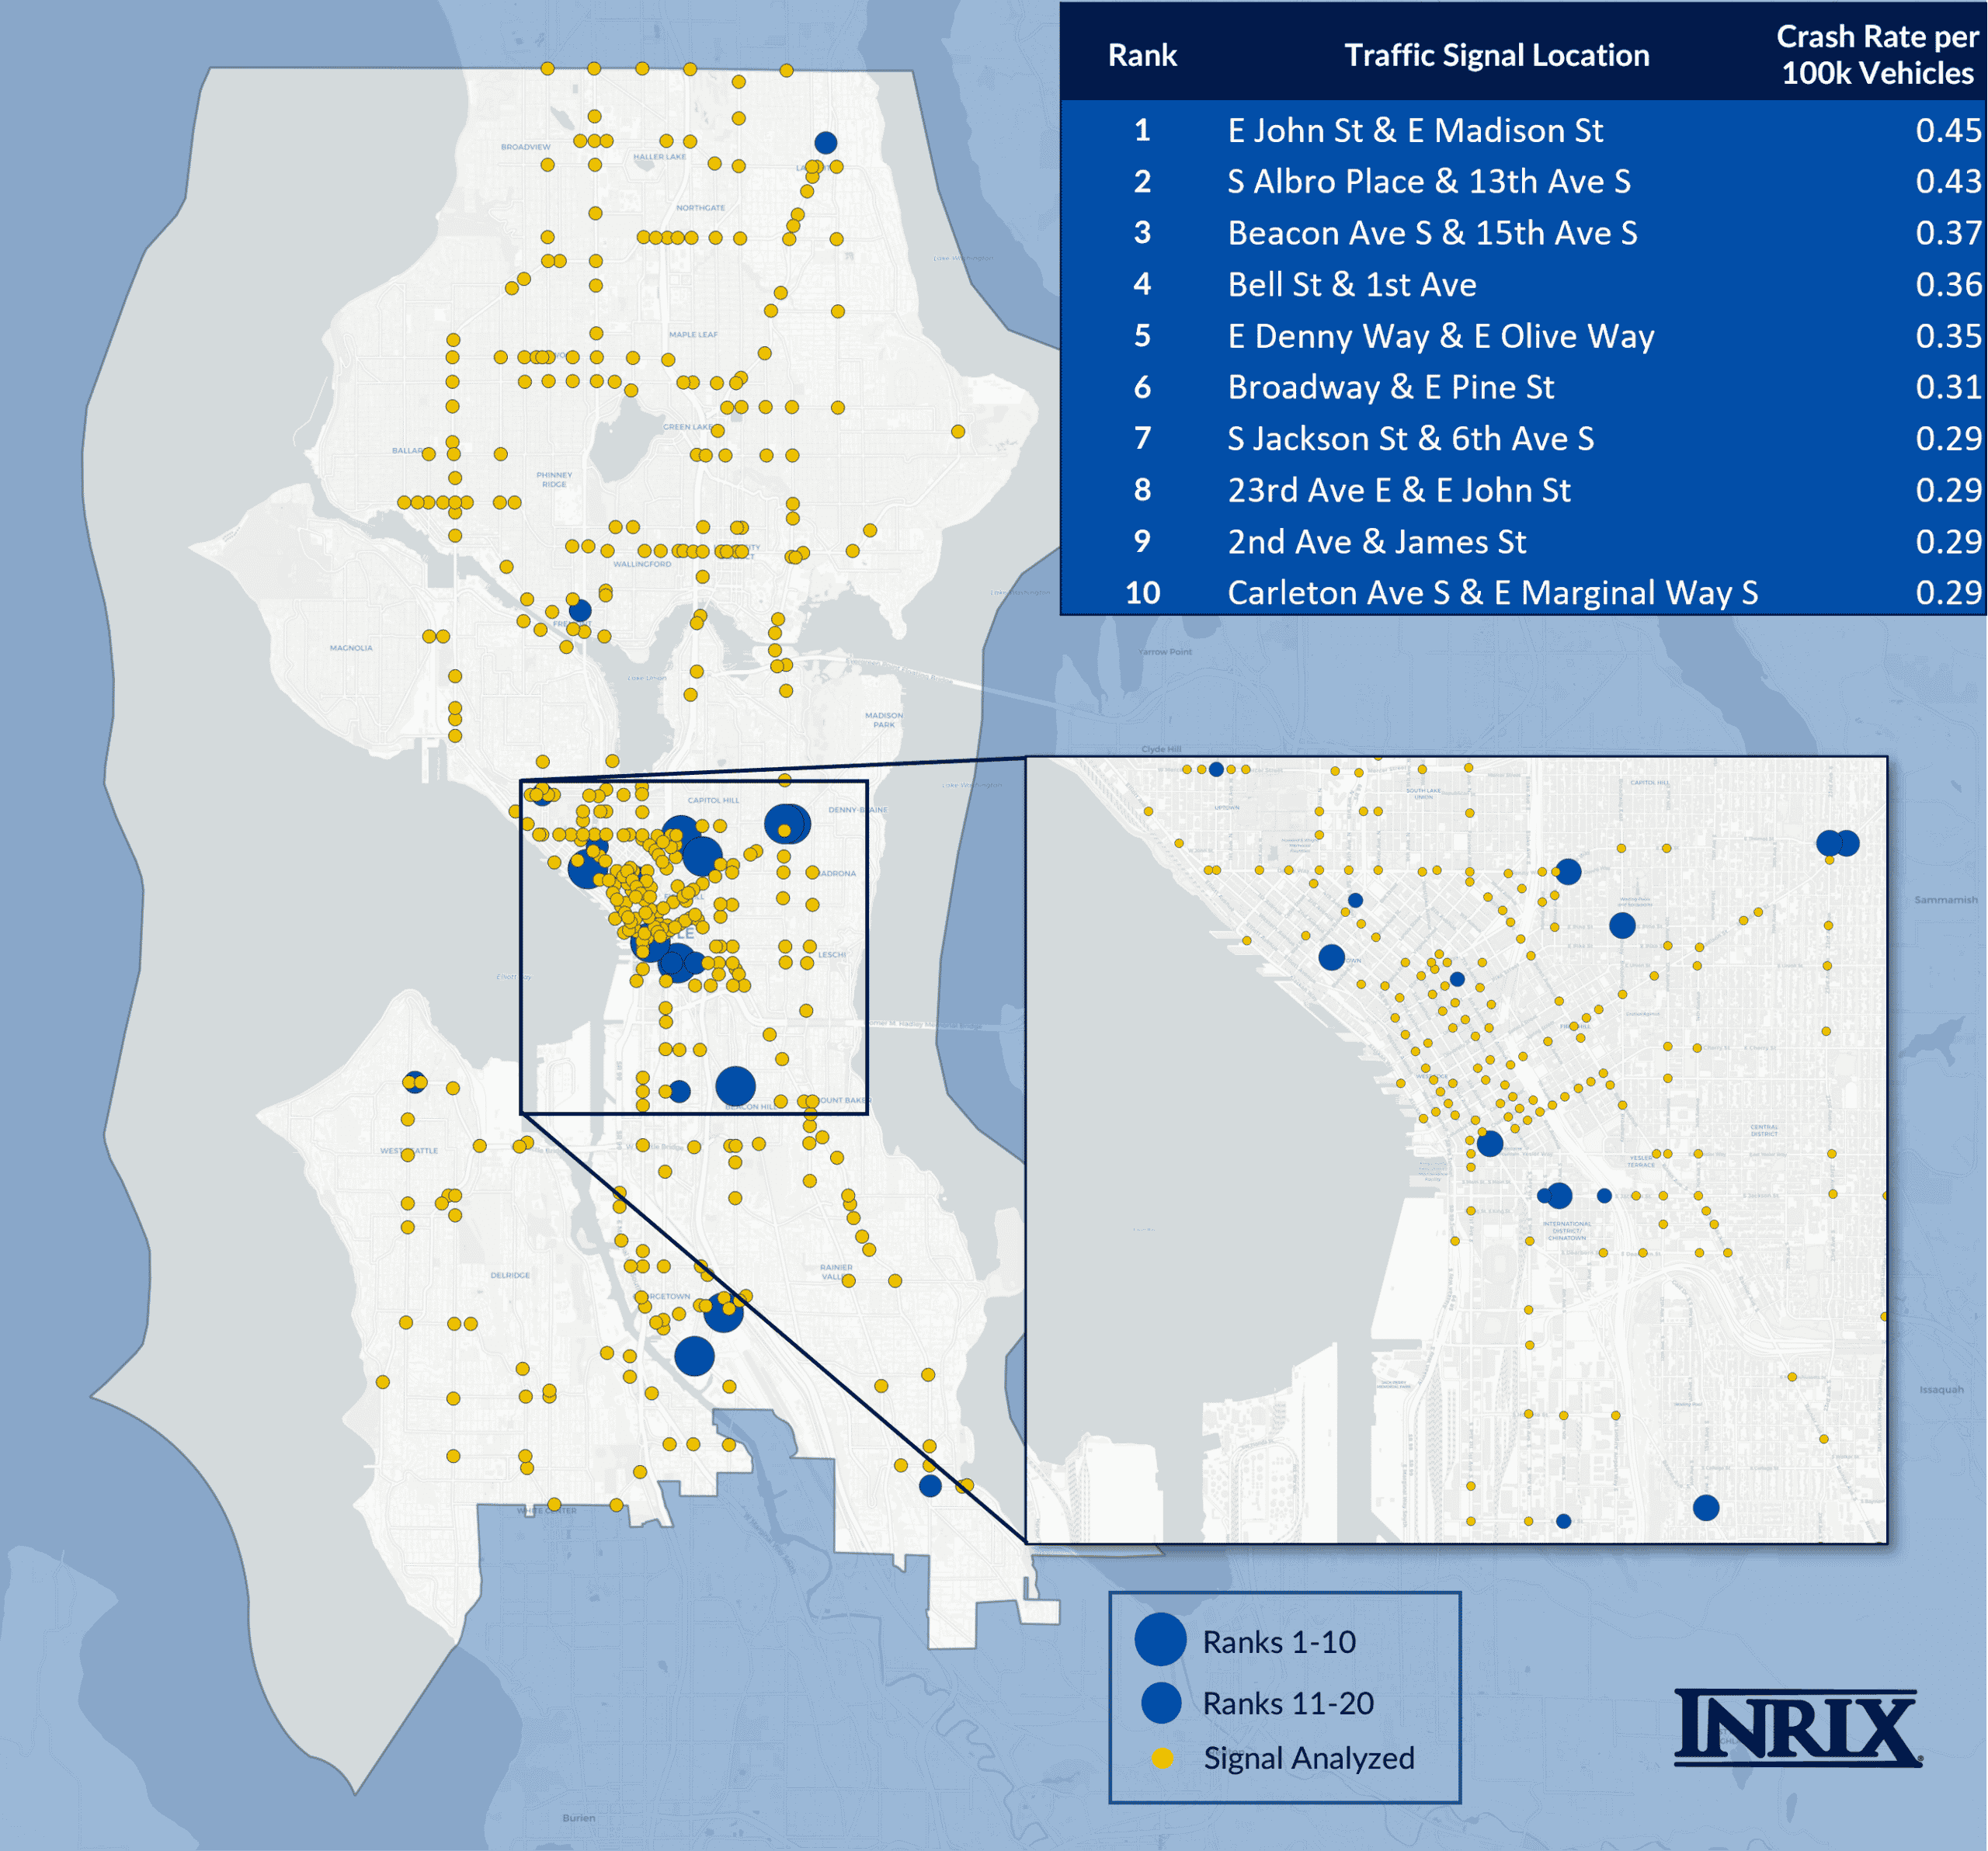
Seattle Results
East John Street & East Madison Street has the most crashes per 100,000 vehicles – followed by South Albro Place & 13th Ave South, with Beacon Ave South & 15th Ave South ranking third.
While E John & E Madison had the highest crash rate, the most crashes (12) occurred near the intersection of Aurora Ave N & North 105 St, which ranked 34th by crashes per 100,000 vehicles. The second-most collisions (9) also occurred on Aurora Ave N, near the intersection of N 85th Street.
Nationally, 40% of collisions occur at intersections, according to NHTSA. During the four months analyzed, Seattle recorded 2,321 crashes, with 1,124 occurring within 400 feet of a signal, representing 48% of reported collisions.
Intersections that ranked 11-20th in Seattle follow:
- Queen Anne Avenue North & West Mercer Street
- 5th Avenue South & South Jackson Street
- North 38th Street & Fremont Way North
- Pine Street & 6th Avenue
- Battery Street & 5th Avenue
- 8th Avenue South & South Jackson Street
- 42nd Avenue Southwest & Southwest Admiral Way
- 6th Avenue South & South Lander Street
- 51st Avenue South & Rainier Avenue South
- Lake City Way Northeast & Northeast 130th Street