


INRIX recently released the 2021 US Signals Scorecard, which analyzes traffic signal performance for more than 240,000 traffic signals – 30,000 more than last year’s study.
Why optimizing traffic signals is important
The report comes at a time when the country’s Bipartisan Infrastructure Law allows for massive investment in ways to reduce oil consumption, increase safety and lower carbon emissions. City, County, Regional Planners, and State Departments of Transportation are looking to invest in technologies that bring immediate and quantifiable benefits to meet key climate and safety targets.
Traditional traffic signals require manual retiming. Best practices call for retiming of urban, high-volume, coordinated systems at least every two years, while rural, isolated, low volume systems every three years. Additionally, retiming signal systems often means defining specs, hiring consultants, collecting data, and modeling those changes – requiring significant amounts of time and effort. Yet newer data-driven technologies allow transportation planners to fast-track many of these processes to improve signal retiming benefit-cost ratio.
Key Findings
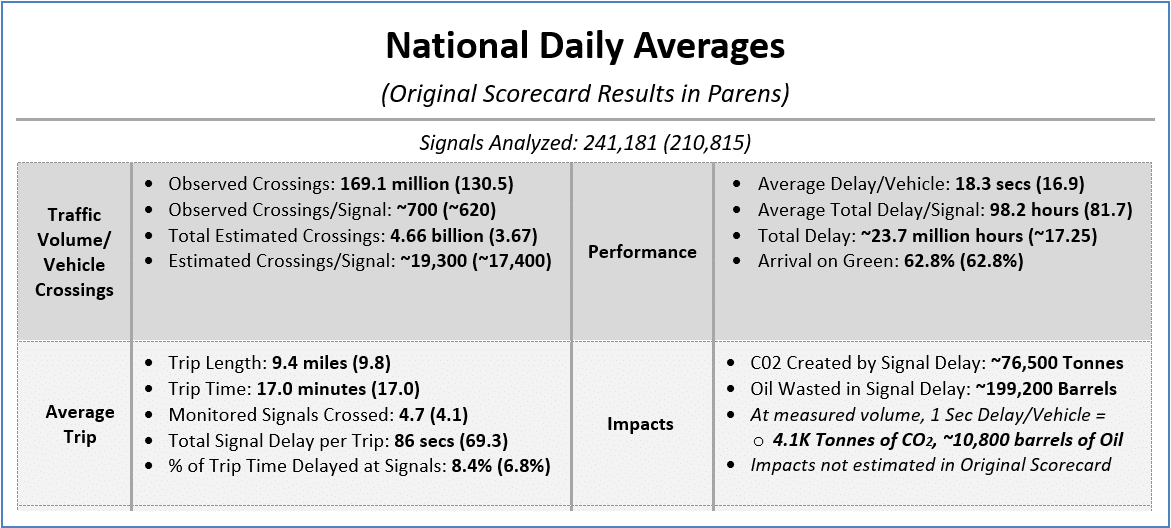
Based on these newest technologies, the Signals Scorecard reveals that traffic signals continue to play a large part in delay and associated carbon emissions. In it, we find that average delay per vehicle increased 20% over last year – resulting in 23.7 million daily hours of delay nationally. This delay is responsible for more than 76,000 tonnes of CO2 emitted, equating to a loss of 199,200 barrels of oil wasted in delay.
Figure 1 reveals that if optimizing signals reduced delay by just one second per vehicle, nearly 4,100 tonnes of CO2 would be abated, and oil demand would fall by 10,800 barrels per day. Annualized, that’s nearly 1.5 million tonnes of CO2 and close to 4 million barrels of oil saved.
Figure 1
How COVID travel changes can be seen through traffic signal data
Compared to the 2020 Signals Scorecard, peak travel demand has significantly increased. As shown in Figure 2, the 2020 Signals scorecard revealed the flattening of the AM peak as well as strong mid-day travel demand. Yet by December 2021, much of the AM peak had returned as traffic volumes throughout the day increased.
Figure 2
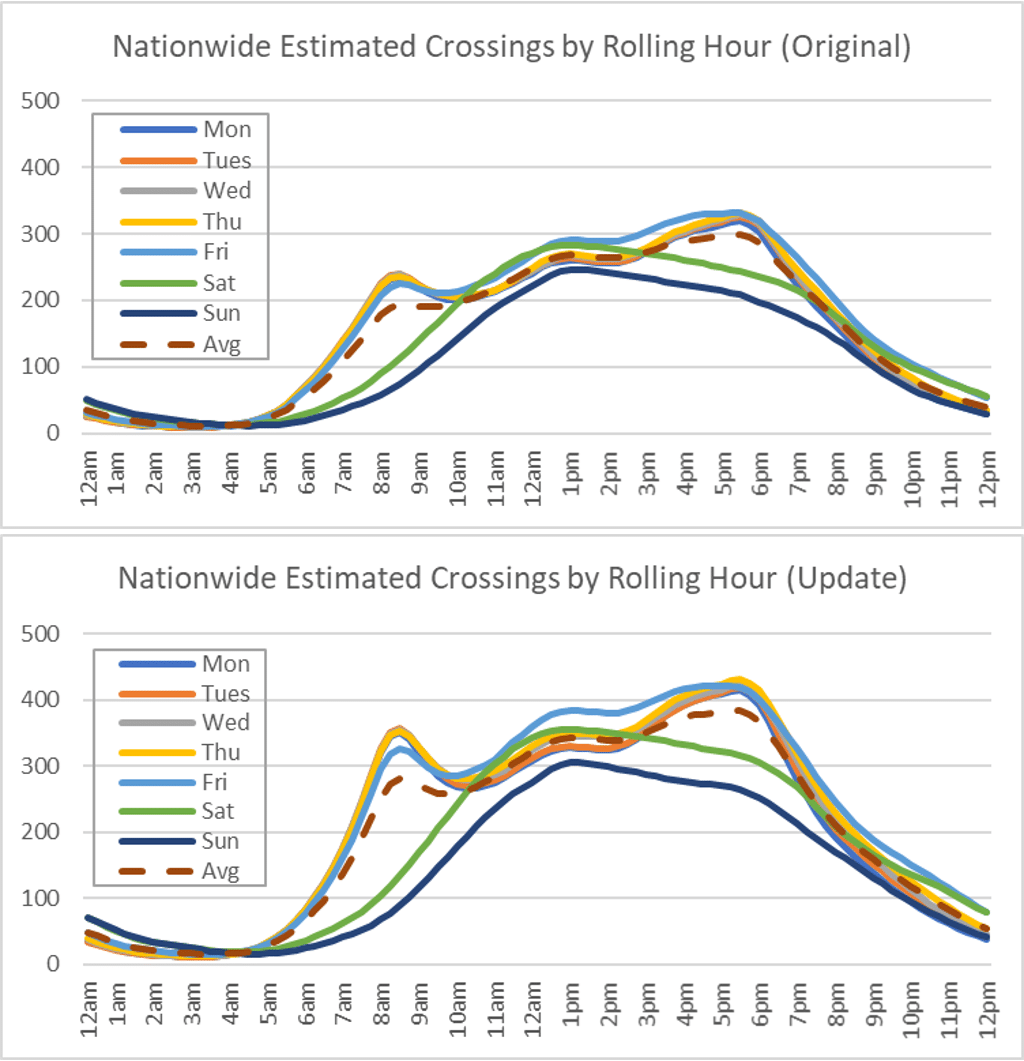
As the data shows, traffic volumes are returning and are beginning to look like “normal,” pre-COVID patterns. As many cities and urban areas continue to reduce COVID-related restrictions and re-emerge, optimizing traffic signals is crucial understanding and adjusting to new travel and commuting habits.
Download the entire scorecard, including the 50 state Appendix