



Over the past several months we’ve heard countless stories about autonomous rideshare vehicles suspending operations because of bad weather, flooded roads, and driving through active work zones across Atlanta, Phoenix, and San Antonio.
In San Francisco on the 4th of July, we saw AV rideshare vehicles lose power due to heavy pedestrian and vehicle congestion requiring operators to send tow trucks to tow stranded vehicles. These are just a few of the most recent challenging road conditions that sidelined AVs. AV rideshare operations are relatively new; these are reasonable growing pains.
However, the question remains – how will AV rideshare companies scale globally when environmental and road conditions vary so much from road to road, city to city, and country to country?
AVs are inherently probabilistic. Automated Driving Systems (ADS) that support AV operations take countless inputs from onboard sensors and external sources. Essentially, all AV driving maneuvers that an AV rideshare vehicle performs are programmed responses and operating instructions given the Operational Design Domain (ODD) boundaries they operate within. When you look at it this way, the simple explanation for why these events happened in San Francisco, Atlanta, and Phoenix is that the ADS models developed to support operations in the defined areas were not properly trained and advanced enough handle the actual operating conditions the vehicles encountered. The question isn’t whether AVs will get better at this — they will. The question is how fast and what data infrastructure makes that possible.
Awareness and Pattern Detection
Conditions like rainfall, fog, and wind are a few of the environmental variables ADS models must account for. Combine those with stationary elements like work and school zones and human factors like getting home to make dinner or pick up a child from daycare; the picture starts to emerge around how complex simulating AV driving conditions can be. It is impossible to simulate every driving condition an AV could expect over its operating lifetime. But, knowing what current and historic speeds look like on a road segment, understanding how congestion (vehicle and VRU) evolves given time of day around a holiday, or start and end times for active work zones are all data points that operators can build patterns around and increase awareness today.
- Planned road closures and known disruptions — Permitted events, scheduled construction, work related lane/road closures filed with municipal authorities. This information exists before any vehicle moves. It should be in the routing layer before dispatch and not discovered when the vehicle enters an impacted road segment.
- Real-time incidents and unplanned disruptions— Accidents, sudden flooding, debris, emergency response activity. These emerge without warning and require a live feed of road condition intelligence so vehicles can be rerouted before entering the affected area.
- Historic congestion and movement conditions — Speed degradation, volume spikes, and pedestrian density historically in the corridors where the vehicle is operating. Analyzed over time, these patterns help operators decide whether to avoid a corridor entirely, time a route differently, or build the condition into the dispatch model.
Each of these streams is a different data source, a different contextual layer, and a different operational application. Together with onboard sensor data, they can help an AV respond better to dynamic road conditions.
What the Data Already Tells Us
The awareness gap isn’t hypothetical—we can see it in the data that already exists today.
On the 4th of July, INRIX VRU data captured exactly what stranded Waymo vehicles in the Presidio. Pedestrian and vehicle congestion in the corridors surrounding the fireworks viewing areas spiked dramatically in the hours following the event. Speed profiles on key exit corridors dropped to near-standstill conditions. Vehicle volumes surged well beyond typical late-evening baselines. None of this was unpredictable—the 4th of July is the single most predictable high-congestion event on the American calendar.
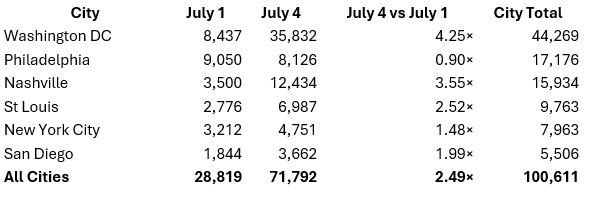
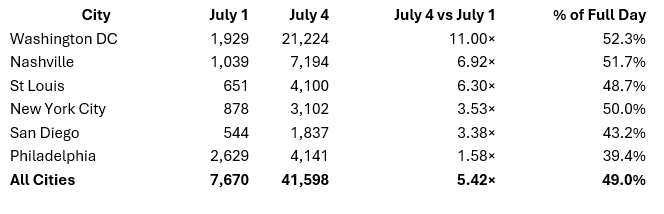
INRIX VRU data analyzed across six major U.S. cities on July 1 and July 4, 2026 — within fireworks venue polygons specifically — shows just how predictable and severe these conditions are
Fourth of July — Non-Vehicle Activity Surge by City
INRIX VRU data analysis — fireworks venue polygons, 2026
Full Day (12AM–12AM local)
Evening Window Only (6PM–12AM local) — Peak Fireworks Period
Non-Vehicle Trip Behavior — Stopped vs. Moving (July 1 & July 4 Combined)
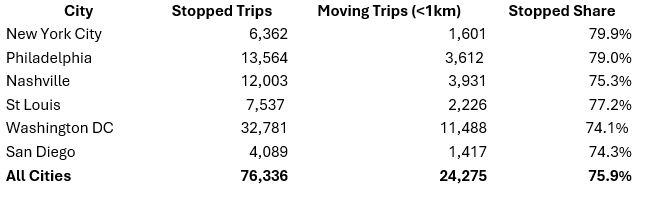
Note: Moving trips defined as trips under 1km in distance. Stopped trips represent pedestrians parking, standing, or gathering rather than actively traversing the corridor.
What This Means
The data tells a clear story. Across six cities on the most predictable high-pedestrian density night of the year, non-vehicle activity surged 2.49x for the full day and 5.42x in the evening window alone. In Washington DC, the evening surge was 11x. Nearly 76% of all non-vehicle trips were stopped rather than moving — crowds gathered in place, not passing through. These aren’t edge cases. They are recurring, calendar-driven, data-confirmed patterns that exist in the historical record before a single vehicle ever moves.
The Waymo vehicles that were stranded in the Presidio on July 4th weren’t defeated by an unknowable event. They were operating without data that already existed — data that would have told a dispatch system exactly what those corridors were about to look like, hours before the fireworks ended and the congestion set in.
This is the awareness gap. And it compounds as AV operations scale. AVs will get better. The sensor stacks will improve, the models will mature, and the incidents will become less frequent. But the operators who compress that learning curve fastest won’t be the ones with the best onboard hardware. They’ll be the ones who stopped treating road intelligence as a navigation input and started treating it as an operational foundation.
Closing the Data Gap With INRIX
The four data streams described earlier in this piece aren’t theoretical — they map directly to products operators can integrate today. INRIX provides the independent, globally sourced road intelligence layer that AV operators need to move from reactive to predictive — across every phase of operations:
VRU Data — Historic non-vehicle activity at the segment level. Know where pedestrians are concentrated, how density evolves by time of day, and which corridors carry elevated VRU risk before dispatch decisions are made. The July 4th data above is a direct example of what this looks like in practice.
Speed Distribution and Volume Profiles — Historic speed degradation and vehicle volume patterns at the road segment level. The foundation for understanding how a corridor performs under normal and abnormal conditions.
Incidents and Closures — Real-time and planned road closures, hazards, active incidents, crashes, construction zones, and permitted events. Information that exists before a vehicle moves and should be in the routing layer before dispatching — not discovered when the vehicle enters an impacted segment.
Roadway Analytics — Granular to the minute to the (XD) segment speed and travel time details going back a decade. Great for corridor and network-level intelligence that connects operational patterns to actionable insights: which segments carry the highest risk under specific conditions, how seasonal and event-driven patterns may affect route reliability, and where ODD boundaries need to flex based on real conditions rather than static assumptions.
Together these data layers don’t replace what AVs can see. They inform what AVs should do before they ever reach the point of having to react.
The awareness gap is real. The data to close it already exists. The question is whether it’s in your stack.