


How do we know whether autonomous vehicles are safer than human drivers?
The answer starts with transportation data.
A recent peer-reviewed study in Traffic Injury Prevention compared Waymo’s Rider-Only autonomous vehicle service against human-driving benchmarks across 56.7 million driverless miles in Phoenix, San Francisco, Los Angeles, and Austin. The researchers found statistically significant reductions in injury crashes, airbag deployment crashes, and serious injury crashes compared to human benchmarks.
But those findings would not have been possible without detailed transportation data, mobility analytics, and roadway exposure measurements that enabled researchers to create fair, apples-to-apples comparisons. For transportation agencies, researchers, and technology providers, the study highlights a larger truth that transportation data is the foundation of modern road safety analysis.
Key Takeaways
- Autonomous vehicle safety cannot be measured using crash counts alone.
- Researchers must account for vehicle miles traveled (VMT), roadway characteristics, traffic exposure, and geographic operating conditions.
- Transportation and mobility data enable AV safety benchmarking and crash rate analysis.
- Exposure-based safety analysis is becoming essential for evaluating autonomous vehicles, Vision Zero strategies, and traffic safety investments.
- High-quality traffic intelligence helps transform safety discussions from assumptions into measurable outcomes.
The Role of Transportation Data in Autonomous Vehicle Safety Research
Transportation data provides the context needed to evaluate safety performance. Simply counting crashes tells only part of the story. Researchers must also understand:
- How far vehicles traveled
- Which roads they used
- Traffic volumes
- Roadway classifications
- Geographic driving patterns
- Exposure to different traffic environments
The Waymo study specifically aligned autonomous vehicle performance with human-driving benchmarks based on vehicle type, roadway type, geographic location, and travel exposure to create meaningful comparisons. Without detailed mobility data and traffic analytics, those comparisons would be difficult to make accurately.
Comparing Autonomous Vehicle Crash Rates with Human Drivers
One of the biggest challenges in autonomous vehicle safety analysis is ensuring an apples-to-apples comparison. Autonomous vehicles do not drive everywhere. They operate within specific service areas, road types, and traffic environments. Human drivers, meanwhile, travel across a much wider variety of conditions. To address this challenge, researchers developed benchmarks using:
- State crash databases
- Vehicle miles traveled (VMT) data
- Roadway classifications
- Geographic operating areas
- Spatial driving distributions
The study even employed a dynamic benchmarking approach that adjusted human-driving comparisons based on where the autonomous vehicles traveled. This is where transportation intelligence becomes critical. The ability to understand traffic patterns, travel demand, roadway usage, and network exposure helps researchers determine whether safety improvements are the result of better technology or simply different driving conditions.
Why Vehicle Miles Traveled Is Essential for AV Safety Benchmarking
Vehicle Miles Traveled, commonly known as VMT, is one of the most important metrics in transportation safety analysis. A vehicle involved in ten crashes over one million miles presents a very different safety picture than a vehicle involved in ten crashes over one hundred million miles. That is why researchers rely on VMT and roadway exposure data to normalize crash rates and calculate meaningful safety benchmarks.
Transportation data helps answer questions such as:
- How much exposure occurred?
- Where did travel occur?
- How often were vehicles operating in complex urban environments?
- What types of roads were involved?
- How did traffic conditions vary over time?
These measurements are essential for evaluating autonomous driving performance and comparing it with human-driven vehicles.
Understanding Exposure-Based Safety Analysis
Exposure-based safety analysis measures risk relative to how much driving occurs rather than simply counting crashes. This approach is increasingly viewed as a best practice in transportation safety research because it accounts for differences in operating conditions and travel behavior. Exposure-based analysis combines:
Traffic Volume Data – Understanding how many vehicles use a roadway.
Vehicle Miles Traveled Data – Measuring roadway utilization and travel exposure.
Roadway Classification Data – Distinguishing highways, arterials, and local roads.
Geographic Mobility Data – Identifying where travel demand occurs.
Safety Event Data – Measuring crashes, injuries, and safety-related outcomes.
Together, these datasets provide a much more accurate picture of transportation system safety than crash counts alone.
Using Traffic Data to Improve Autonomous Vehicle Safety
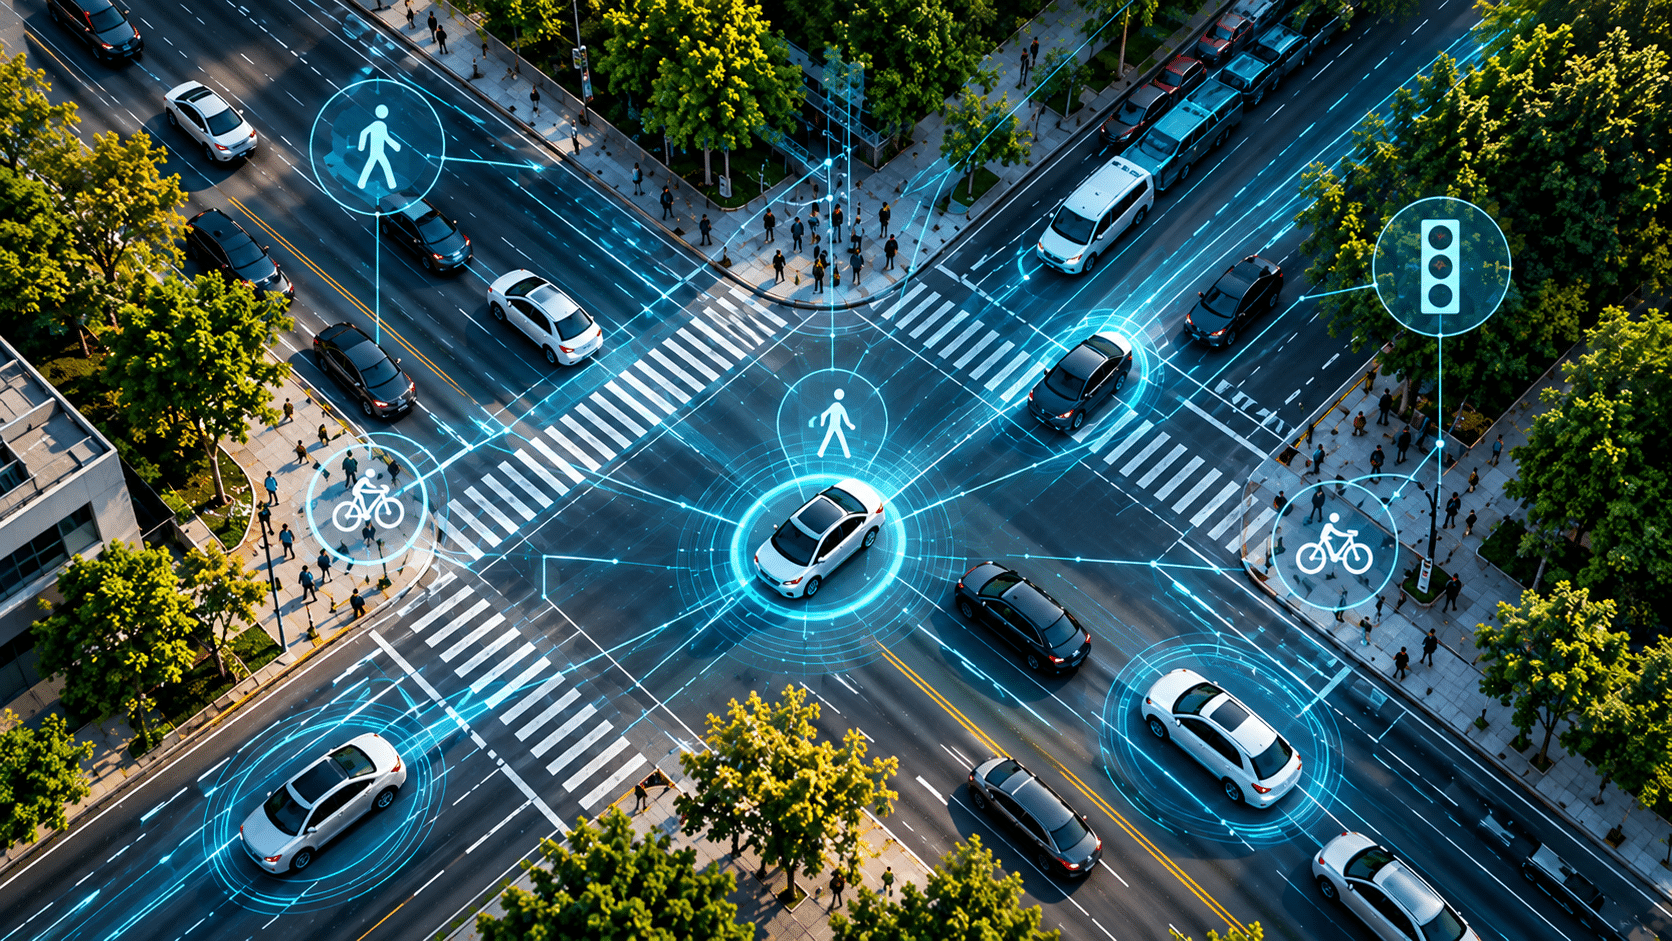
Autonomous vehicles rely on an ecosystem of data to operate safely. Similarly, researchers rely on transportation intelligence to evaluate whether those systems are delivering safer outcomes. Traffic and mobility data help identify:
- High-risk corridors
- Crash-prone intersections
- Congestion patterns
- Vulnerable road user exposure
- Traffic signal impacts
- Roadway risk factors
- Changes in travel behavior over time
In the Waymo study, some of the largest statistically significant safety improvements occurred in intersection-related crashes as well as collisions involving pedestrians, cyclists, and motorcyclists. Understanding where, when, and how those interactions occur requires detailed transportation analytics. The result is more transparent, data-driven safety evaluation.
Transportation Analytics Beyond Autonomous Vehicles
The value of transportation intelligence extends far beyond AV safety benchmarking. The same mobility data used to evaluate autonomous vehicle performance can also help support:
Vision Zero Programs – Identify high-risk locations and prioritize safety investments.
Road Safety Analytics – Measure the effectiveness of roadway improvements.
Transportation Planning – Understand how travel demand changes across regions.
Traffic Operations Management – Monitor congestion, bottlenecks, and network performance.
Infrastructure Investment Decisions – Help agencies target funding where it can deliver the greatest safety impact.
Freight and Logistics Analysis – Improve mobility, efficiency, and supply chain performance.
Whether evaluating autonomous vehicles or improving a dangerous intersection, data provides the evidence needed to make better decisions.
Transportation Intelligence and the Future of Road Safety
As transportation systems become increasingly connected, automated, and data-driven, expectations for safety measurement are rising. Cities want evidence. Researchers want defensible methodologies. Regulators want objective benchmarks. The public wants confidence.
The recent Waymo study demonstrates that credible safety evaluations require more than crash reports alone. Researchers must understand roadway exposure, travel patterns, geographic operating environments, and vehicle miles traveled to develop meaningful comparisons. Transportation intelligence makes that possible.
As autonomous vehicles, connected infrastructure, and AI-powered mobility systems continue to evolve, transportation data will become even more valuable. It is the foundation that helps cities improve safety, researchers evaluate innovation, and transportation leaders make better decisions.
The future of safer roads won’t be built on technology alone. It will be built on data that allows us to measure, understand, and improve transportation performance with confidence.