


You aren’t imagining it. Traffic is getting worse. As infrastructure ages and population and economic growth put more strain on the road network, traffic congestion grows, resulting in billions of dollars in lost time, wasted fuel, and excess carbon emissions.
In fact, the latest driving data from the Federal Highway Administration reveals that through September 2025, vehicle-miles traveled has surpassed its pre-COVID heights and is now trending toward a record-setting year.
U.S. Traffic Delay Results
Delays across the country generally increased, with 248 urban areas seeing more congestion in 2025 than the prior year. Just 12 urban areas experienced a reduction in delay while 30 remain unchanged from 2024. Despite such a widespread increase, however, a few major, dense urban areas saw decreases in traffic similar to some European and Canadian counterparts.
New York, for example, saw no growth in delay, signaling that congestion pricing – though geographically a relatively small area – may be a factor. Similarly, delays fell 1% in Los Angeles, the densest urban area in the U.S., to 86 hours per driver.
The two most-populated urban areas compared similarly to other global cities in the West, with delays falling 10% in London, 7% in Paris and 3% in Toronto.
New York’s “unchanged” status resulted in Chicago taking the top spot in the U.S. ranking at 112 hours lost in traffic in 2025, up 10% from 2024. Below are the top 10 most-congested urban areas in the U.S.:
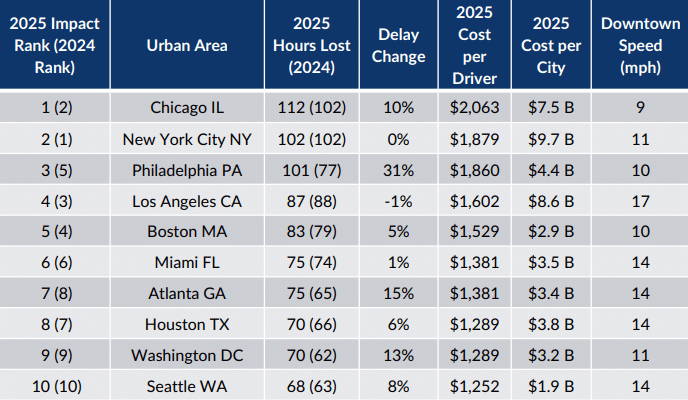
On average, the typical driver in the U.S. lost 49 hours to traffic congestion, up 6 hours from 2024, losing approximately $894 in lost time. Combined, traffic congestion cost the country at least $85.8 billion in lost time, which doesn’t include the cost to trucking and congestion outside of the peak periods.
Infrastructure Funding Shortfalls
The news comes at a time when the Highway Trust Fund continues to operate in the red. By 2029, the Congressional Budget Office estimates the fund will spend $40 billion more than it receives in fuel tax revenues (and other sources) during FY2029. This means that Congress will either a) continue to use general taxation or deficit spending to shore up the account; b) raise the federal gas tax; c) eliminate diversion by removing the Mass Transit Account from the Highway Trust Fund; d) some other measure, like devolution, or some combination of the above.
Traffic Safety
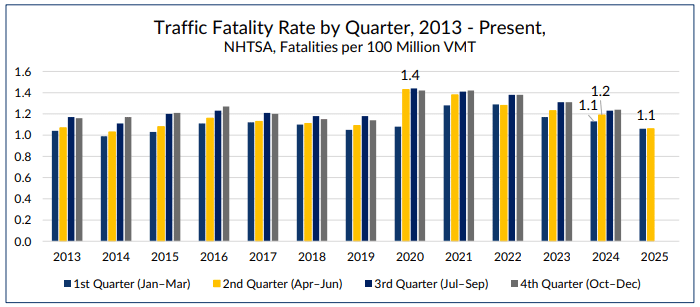
The good news is that safety improved in the first half of 2025 (the second half is yet to be released). The National Highway Traffic Safety Administration data shows that in the first half of 2025, 1.1 fatalities occurred on roadways for every 100 million miles traveled, down significantly from the COVID-era high of 1.4 per 100 million miles of travel, a decrease of 21% in the fatality rate.
Working from Home
Working from home fell a relatively modest 2% between 2023 and 2024, per the latest data released in November 2025 from the U.S. Census Bureau, falling from about 22.5 million people in 2023 to 22.0 million in 2024. The dataset insinuates a weak “Return to Office” effort.
Transit Ridership
As of August 2025, transit ridership was up just 3% over 2024 levels, with 5.1 billion transit trips taken since the start of the year. However, transit ridership still continues to lag pre-COVID ridership levels by about 20%, suggesting that remote work is competing with transit trips as a commute mode.
Conclusion
You aren’t imagining it, you probably stared at the bumper in front of you a little more in 2025, the degree of which varies by metro area. Despite the slow return to office buildings, drivers are traveling more than ever. In the first nine months of the year, the Federal Highway Administration estimates drivers traveled 2.467 trillion miles, besting 2019’s record-setting 2.456 trillion miles.
While the country seems on track to finish the year with a new driving record, uncertainty still exists that may affect driving in 2026. Return to office driving seems to be slowing down, yet any change in working from home could affect conditions on the road network. In addition, should international trade slow or the economy decelerate, we should expect to see reductions in the growth of congestion.
It also remains to be seen whether public transport will shoulder more of the load moving forward. While year over year growth is good news, transit agencies across the country are investing billions into expansion in hopes that riders return to their services. How expansion plans match up with working from home, one of its biggest “competitors,” is still uncertain.
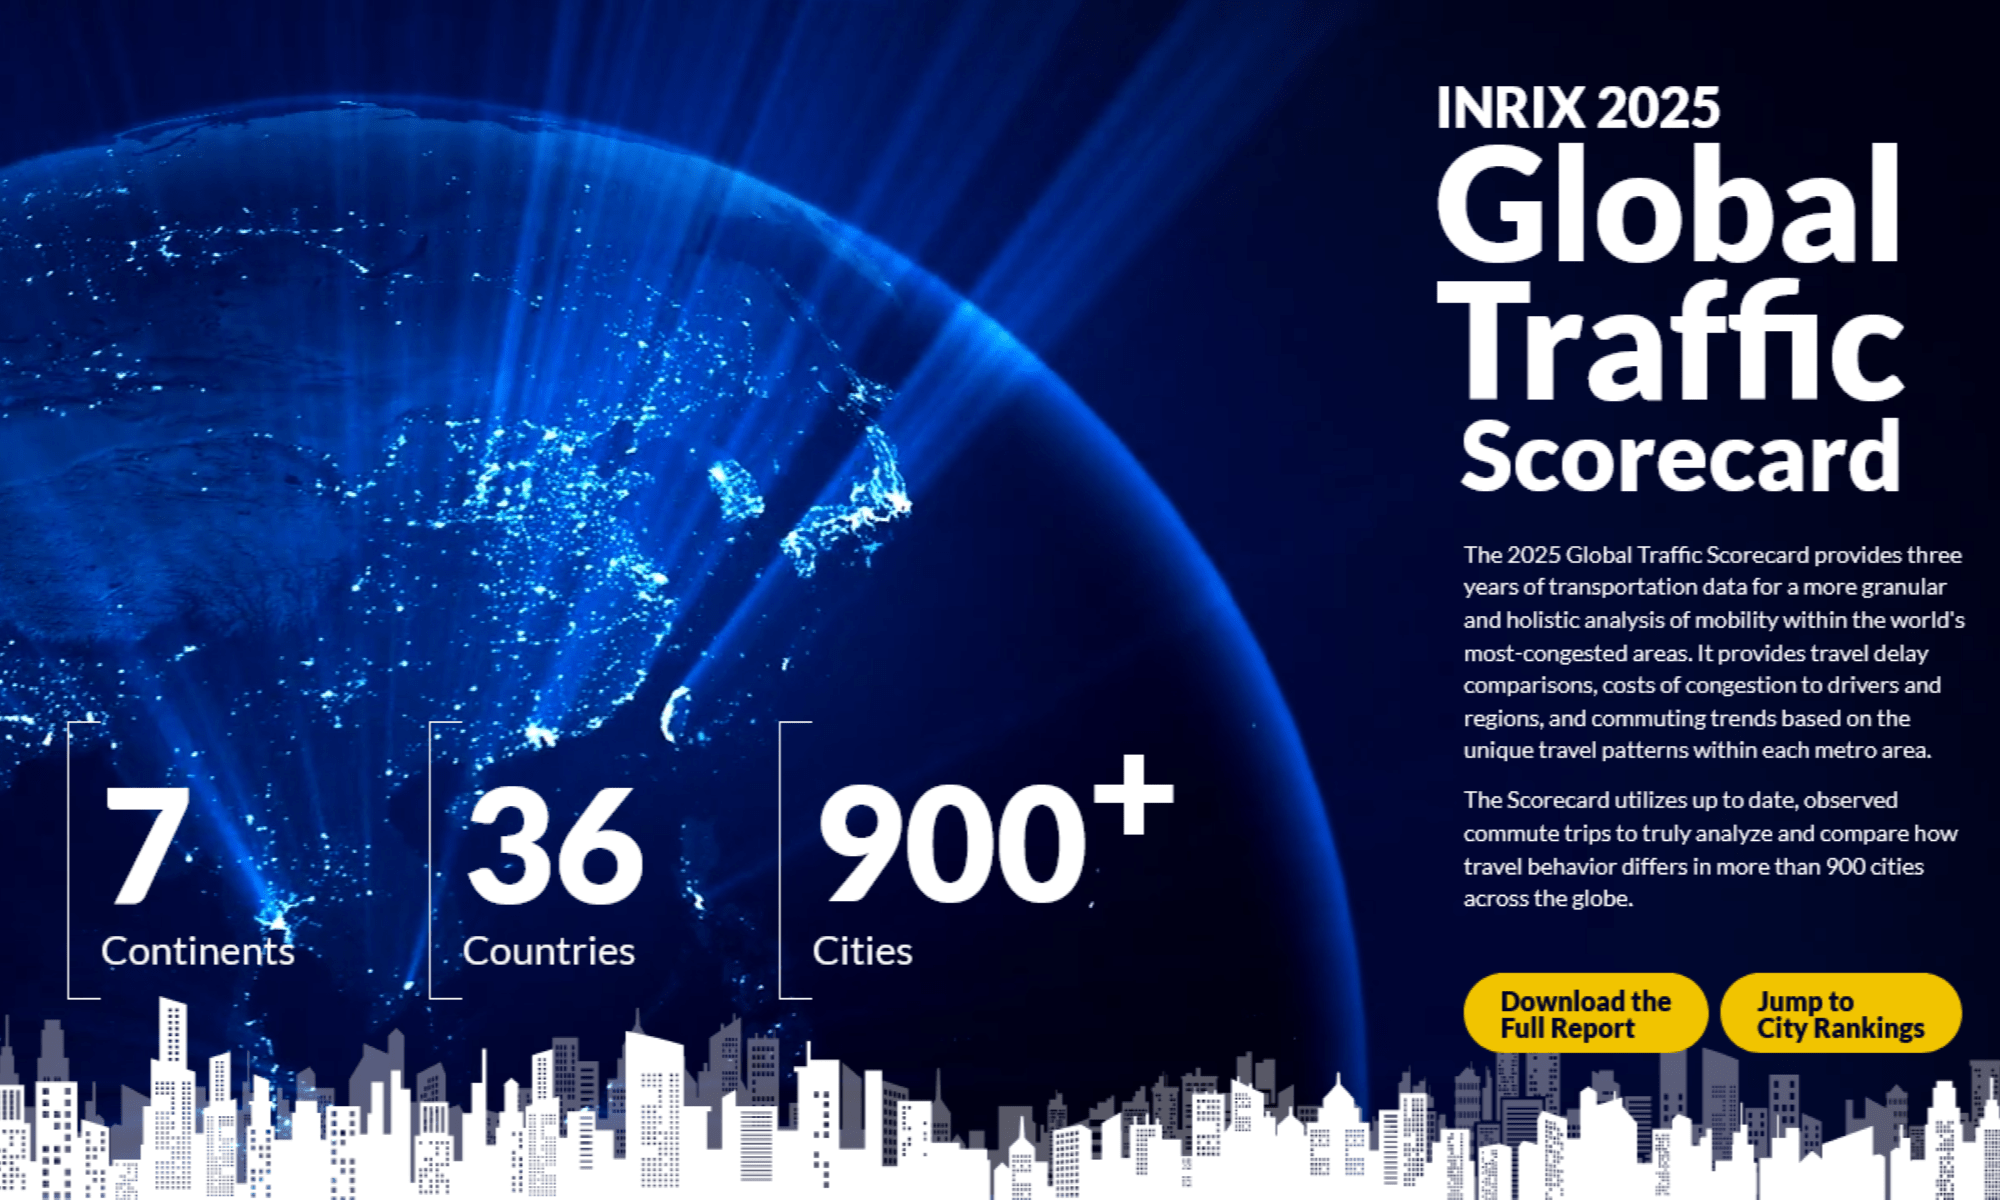
Learn more about the 2025 INRIX Global Traffic Scorecard here.