


As we know, COVID-19 has sent the United States and much of the world into lockdown, affecting all modes of transportation as fewer people were out on the roads. This had a major effect on vehicle miles traveled (VMT) in cities across the country, causing travel to plummet when employers implemented “work from home” policies and public officials heightened restrictions on the economy.
| Week Date | Metropolitan Area | VMT Growth Since April |
| 7/27/2020 | Portland-South Portland-Biddef, ME | 163% |
| 7/27/2020 | Mobile, AL | 154% |
| 7/27/2020 | New York City, NY | 151% |
| 7/27/2020 | Colorado Springs, CO | 143% |
| 7/27/2020 | Allentown-Bethlehem-Easton, PA-NJ | 137% |
| 7/27/2020 | Detroit, MI | 137% |
| 7/27/2020 | Grand Rapids, MI | 136% |
| 7/27/2020 | Philadelphia, PA | 133% |
| 7/27/2020 | Knoxville, TN | 133% |
| 7/27/2020 | Pensacola-Ferry Pass-Brent, FL | 131% |
| 7/27/2020 | Denver, CO | 131% |
| 7/27/2020 | Lansing-East Lansing, MI | 129% |
| 7/27/2020 | Poughkeepsie-Newburgh-Middleto, NY | 125% |
| 7/27/2020 | Boston, MA | 124% |
| 7/27/2020 | Hartford, CT | 122% |
| 7/27/2020 | Providence, RI | 120% |
| 7/27/2020 | Harrisburg-Carlisle, PA | 117% |
| 7/27/2020 | Salinas, CA | 113% |
| 7/27/2020 | Albany-Schenectady-Troy, NY | 112% |
| 7/27/2020 | San Diego, CA | 111% |
| 7/27/2020 | Toledo, OH | 109% |
| 7/27/2020 | Minneapolis-St. Paul, MN | 108% |
| 7/27/2020 | Scranton-Wilkes-Barre, PA | 108% |
| 7/27/2020 | Manchester-Nashua, NH | 107% |
| 7/27/2020 | Baltimore, MD | 106% |
As state and local governments began reopening, some schools and businesses resumed in-person activities, leading to increases in VMT. To compare how things have changed since the April low, INRIX Trip Trends calculated VMT during the week of July 27 against the first two weeks of April (when VMT was at its lowest point nationwide). Though one common thread of each MSA is that each saw VMT levels more than double – many of these cities could not be more opposite of each other.

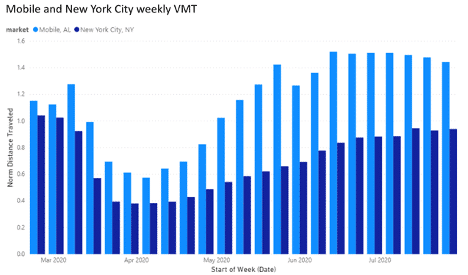
Looking at the five cities that gained the most in VMT, we see that four of them increased at a steady state from the middle of April through June. During July, these cities began to plateau. Mobile, Alabama had a steep increase in VMT through the end of May, dropping again the first week of June before reaching 250%. Since then, it has fallen to the other four counties’ VMT.

New York City’s population is 8.4 million, while the population of Mobile, Alabama is 190,000. Despite the population and geographic differences, they share a common VMT growth pattern. Both cities have increased by more than 250% since their lowest point in April. While they share similar grow patterns, Mobile has surpassed its pre-COVID VMT experienced in March, while New York has yet to reach their pre-COVID VMT levels.Looking at the five cities that gained the most in VMT, we see that four of them increased at a steady state from the middle of April through June. During July, these cities began to plateau. Mobile, Alabama had a steep increase in VMT through the end of May, dropping again the first week of June before reaching 250%. Since then, it has fallen to the other four counties’ VMT.
INRIX is monitoring the changes in VMT around the nation as COVID continues to impact our roadways. Check back for additional insights.