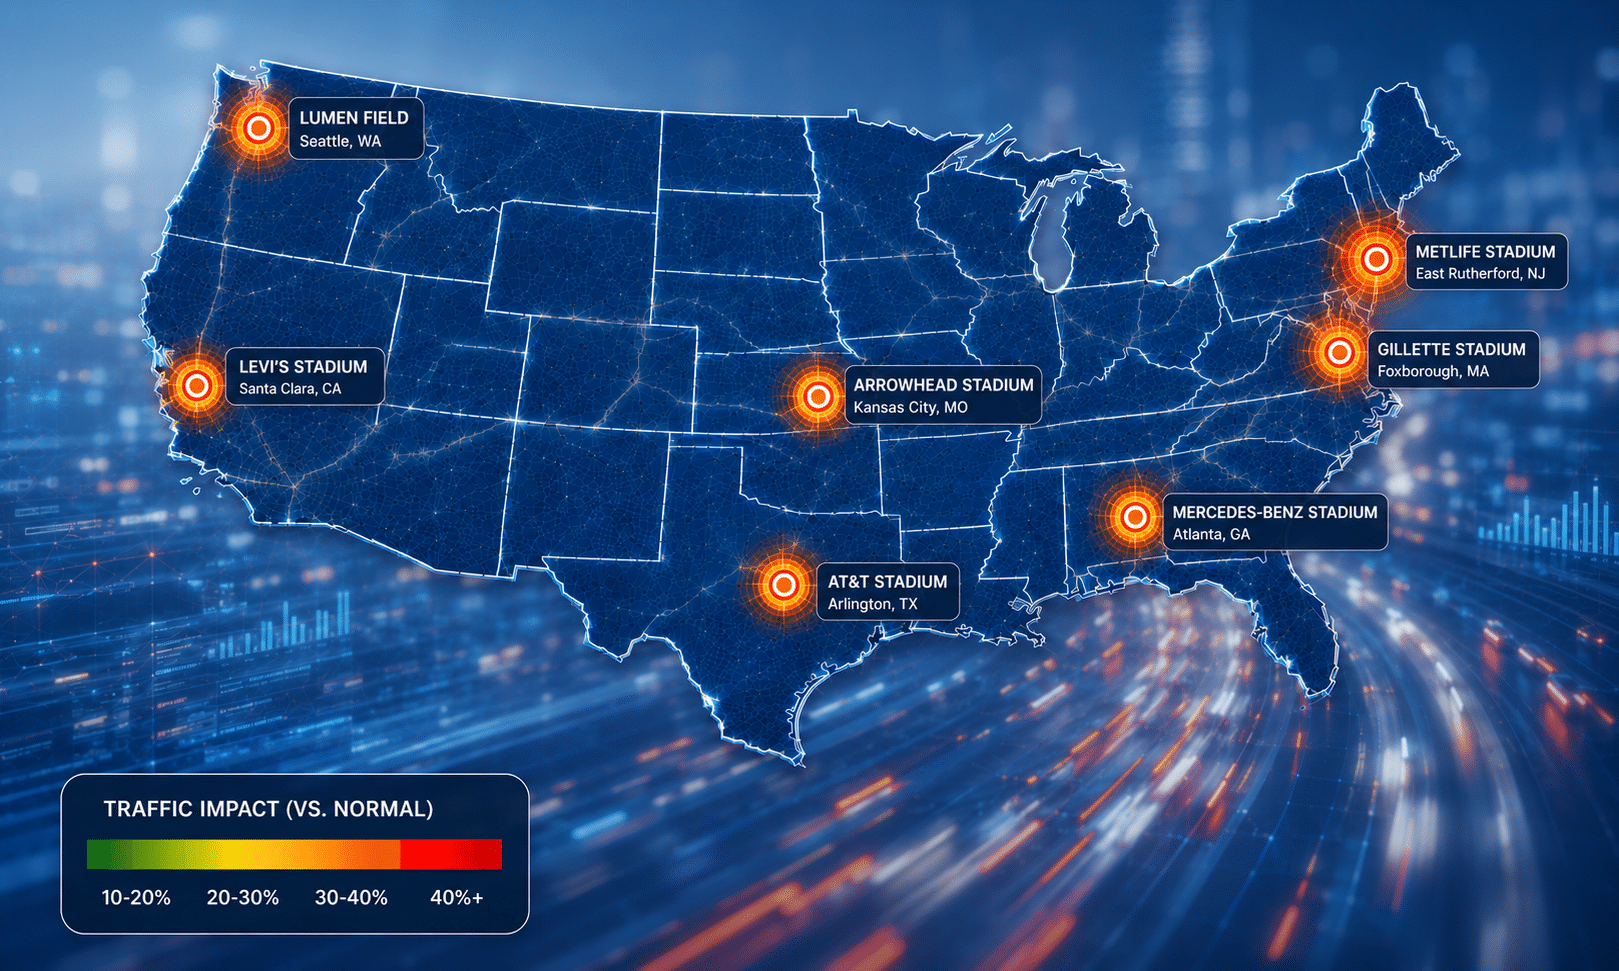


The 2026 FIFA World Cup brought hundreds of thousands of fans to stadiums across the United States, creating noticeable changes in traffic conditions around host venues. Using INRIX traffic data, this analysis examines how vehicle speeds within one mile of the 11 U.S. World Cup stadiums changed before and after matches compared with typical conditions.
The findings highlight which venues experienced the greatest congestion, where traffic impacts were relatively minimal, and how pre- and post-match travel patterns differed across host cities. For more information on the tournament’s initial traffic impacts, read our earlier analysis of the FIFA World Cup Mobility Insights.
Within one mile of all 11 U.S. stadiums hosting FIFA World Cup events, MetLife Stadium is the most congested, on average. Before FIFA events at MetLife, speeds generally dropped between 30-40% vs normal, while postgame traffic speeds ranged similarly. On the other hand, travel speeds within one mile of Lumen Field in Seattle fell less than 10% across all games during both pre- and post-game.
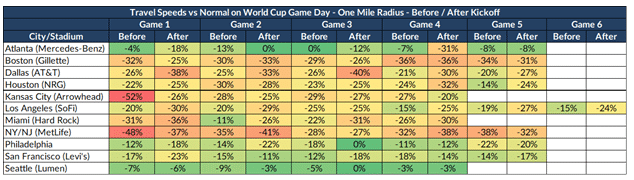
Arrowhead Stadium in Kansas City, MO and Gillette Stadium near Boston, MA also saw significant delays pregame, with traffic speeds falling around 30% versus normal on average. Games in Atlanta and in Seattle saw the least delays pregame, with the worst being Atlanta before Game 2 at a 13% reduction.
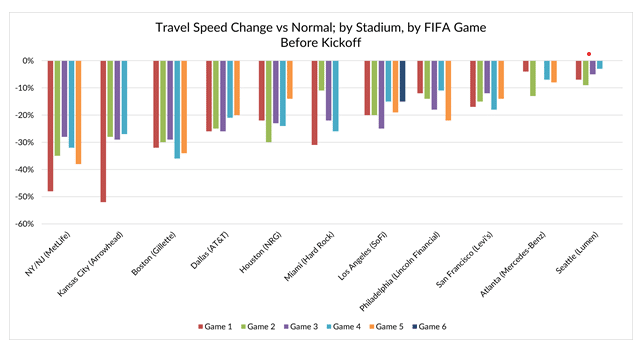
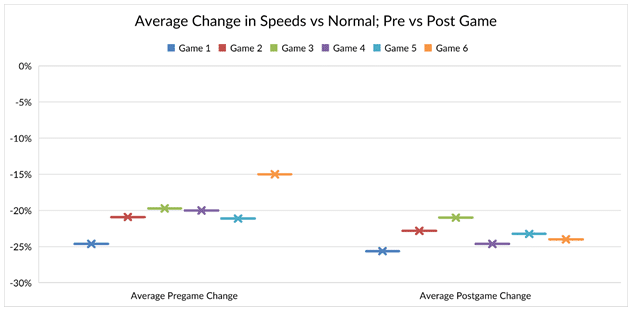
Post game saw a slightly larger reduction in speeds overall, though “normal” traffic speeds are typically higher taking into account evening games. The average game played across all stadiums saw a 21% reduction in speed pregame, versus a 23% reduction in speed postgame.
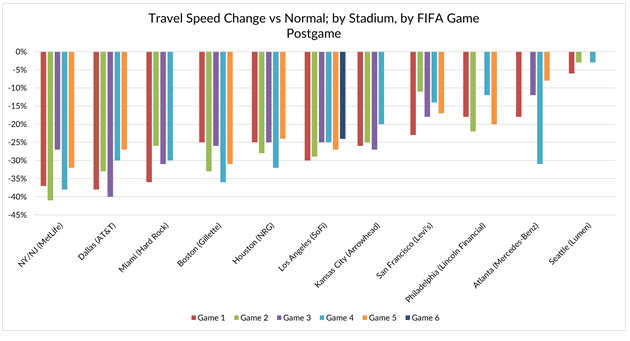
The largest discrepancies were seen in Dallas and in Kansas City. In Dallas, pregame speed drops were significantly less than postgame drops, while in Kansas City, pregame speed drops were significantly higher than postgame drops.
However, more investigation would be needed by day of week and time of day for a more thorough analysis of World Cup impacts to traffic.