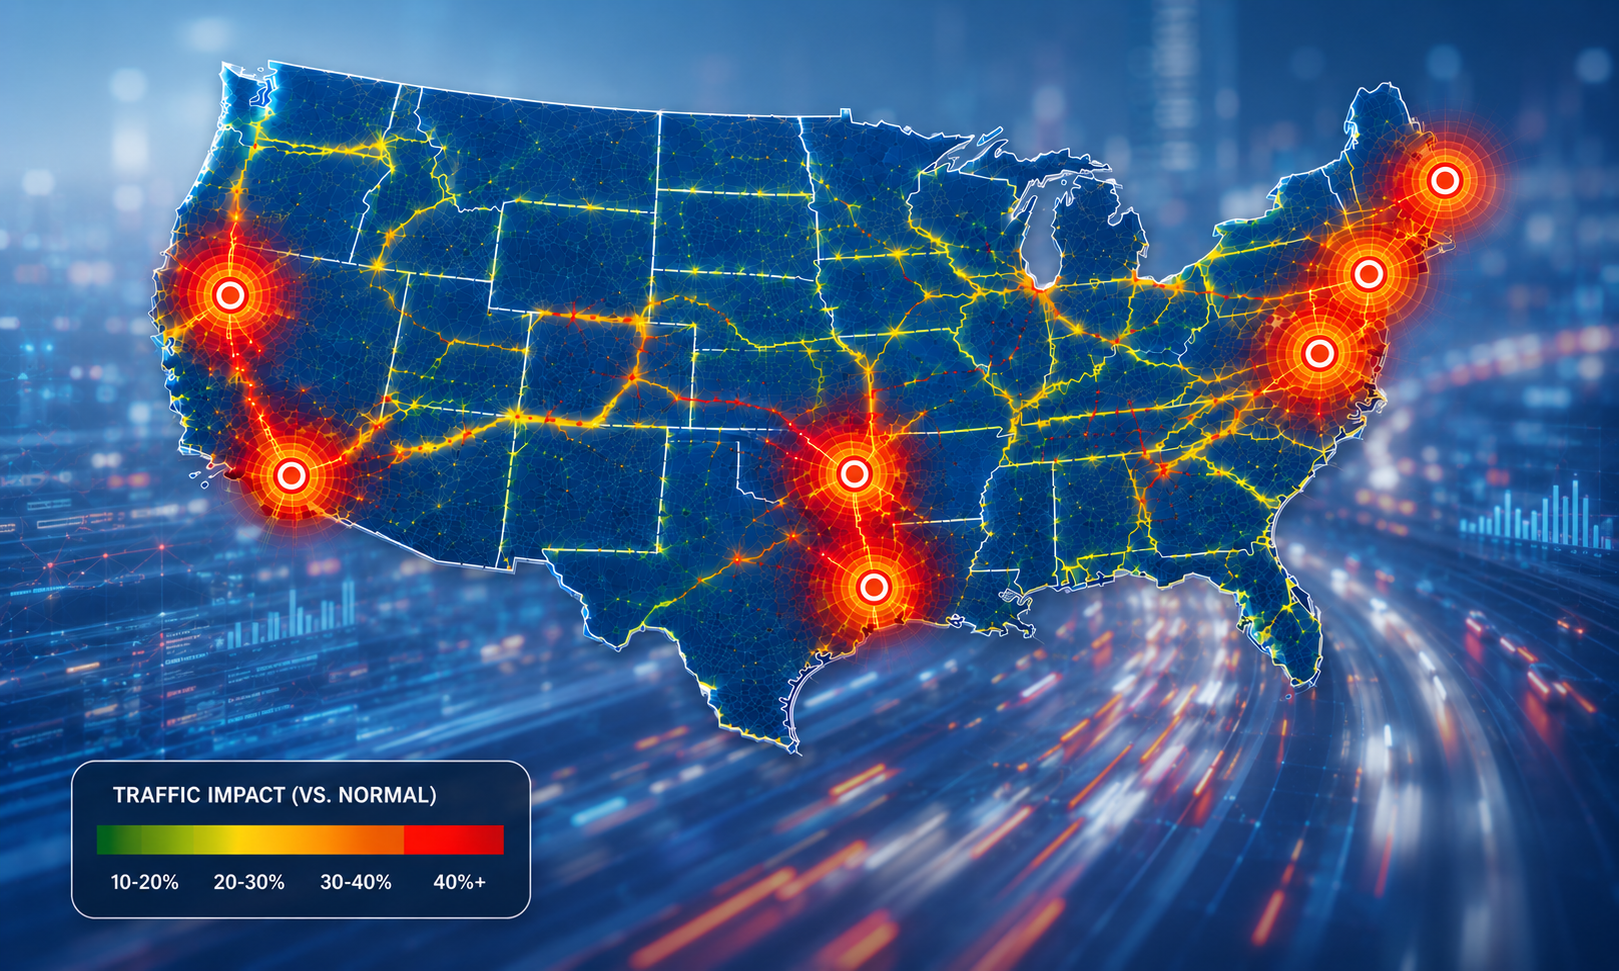


The opening weekend of the 2026 FIFA World Cup delivered historic moments on the pitch and significant transportation challenges on the roads surrounding host venues across the United States. With millions of fans traveling to matches, host cities experienced notable fluctuations in traffic conditions before and after kickoff.
Using INRIX mobility data, we analyzed traffic performance within a one-mile radius of seven stadiums that hosted matches during the tournament’s first three days. The results reveal how event timing, venue location, and fan travel patterns influenced congestion levels, providing an early look at the transportation impacts of one of the world’s largest sporting events.
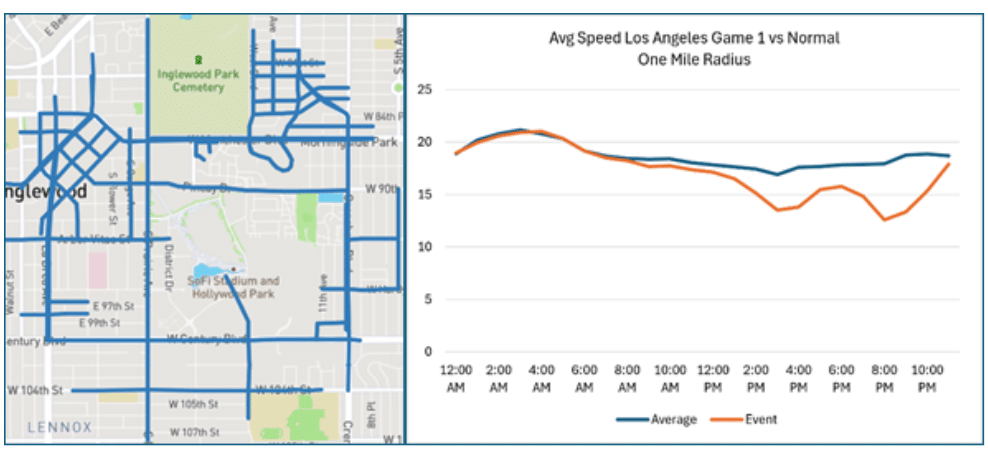
June 12, 2026 – SoFi Stadium – Los Angeles, CA – 6:00pm Kickoff
In the one-mile radius around SoFi stadium traffic speeds began to fall around 1:00pm, two hours before kickoff time. By the 3:00pm and 4:00pm hours, traffic had slowed about 20% versus normal Friday traffic, to 13.5 mph. Traffic speeds began to rise yet fell significantly after the event during the 8:00pm hour, when travel speeds plummeted 30% versus normal to 12.6 mph. Traffic recovered to normal around the stadium by the 11:00pm hour.
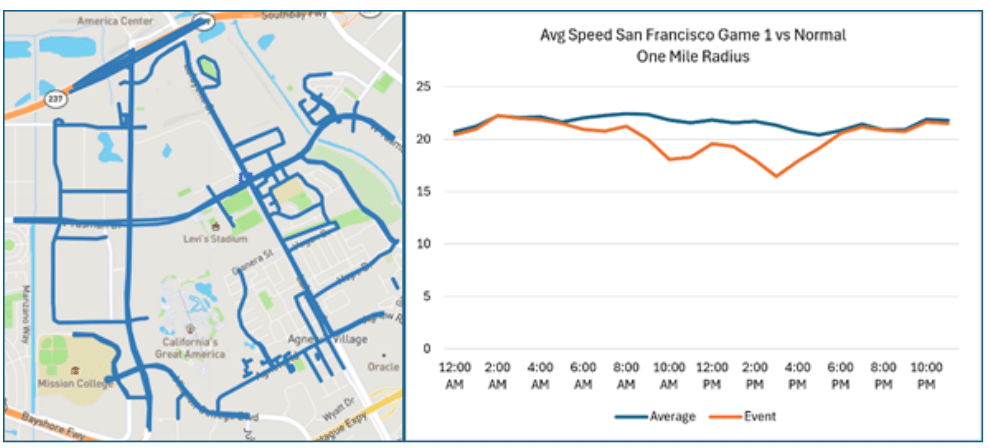
June 13, 2026 – Levi’s Stadium – Santa Clara, CA (San Francisco) – 12:00pm Kickoff
Levi’s Stadium hosted the noon kickoff for the first of three Saturday games in the United States, which caused traffic to slow 17% versus normal within a one-mile radius of the stadium during the 10:00am hour. Traffic pains eased only to significantly drop further to 23% by the 3:00pm hour, and by 6:00pm had fully recovered to normal.
June 13, 2026 – MetLife Stadium – Newark, NJ (NY/NJ) – 6:00pm Kickoff
Travelers to Metlife Stadium saw the biggest drop of all stadiums analyzed within one mile of the stadium before kickoff. During the 4:00pm hour, traffic was at its worst when speeds fell to 13.9 mph, a 48% reduction from the 26.7 mph norm. Traffic recovered during kickoff only to fall to 17.7 mph in the 9:00pm hour as people exited the stadium, 37% slower than normal.
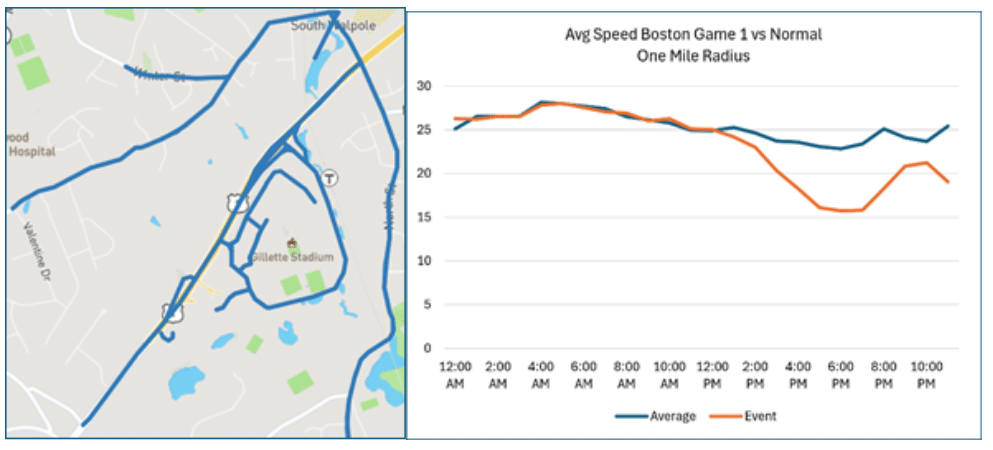
June 13, 2026 – Gillette Stadium – Foxborough, MA (Boston) – 9:00pm Kickoff
Speeds around Gillette Stadium slowed significantly leading up to the 9:00pm kickoff, with traffic speeds falling 32% of normal to 15.8 mph during the 7:00pm hour. Speeds were continually below normal all through the night, falling again at the 11:00pm hour, when travel speeds were 25% below normal.
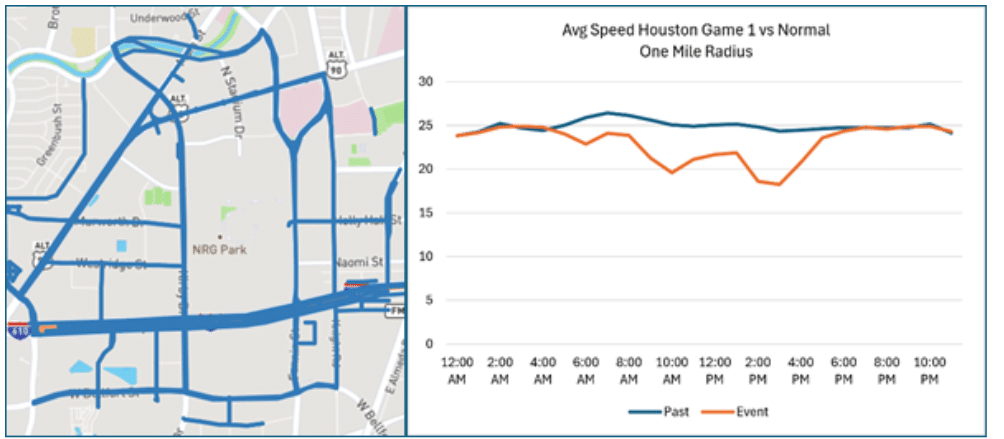
June 14, 2026 – NRG Stadium – Houston, TX – 12:00pm Kickoff
Visitors to NRG Stadium in Houston saw 22% slower speeds versus normal within one-mile of the stadium when speeds fell to 19.6 mph when compared to the 25.1 mph normal average. However, travelers saw a more significant drop post-game as speeds fell to 18.3 mph versus the normal 24.4 miles per hour. Travel speeds had mostly recovered around the stadium by 5:00pm as traffic quickly dissipated.
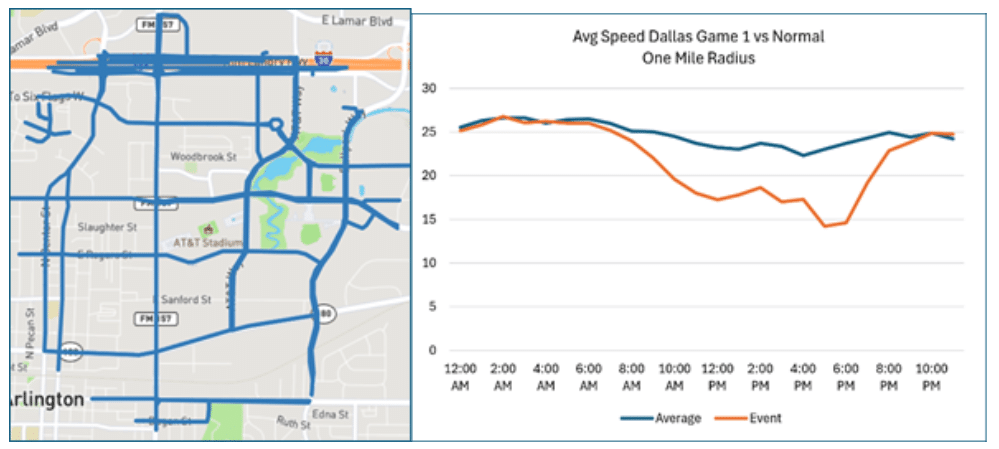
June 14, 2026 – Dallas Stadium – Dallas, TX – 3:00pm Kickoff
Dallas Stadium saw traffic speeds fall during a 12:00pm peak of 17.3 miles per hour, a 26% drop from the 23.2 mph seen on previous Fridays. Similar conditions continued through the early afternoon until the game ended, when travel speeds plummeted 38% during the 5:00pm and 6:00pm hours to 14.2 mph.
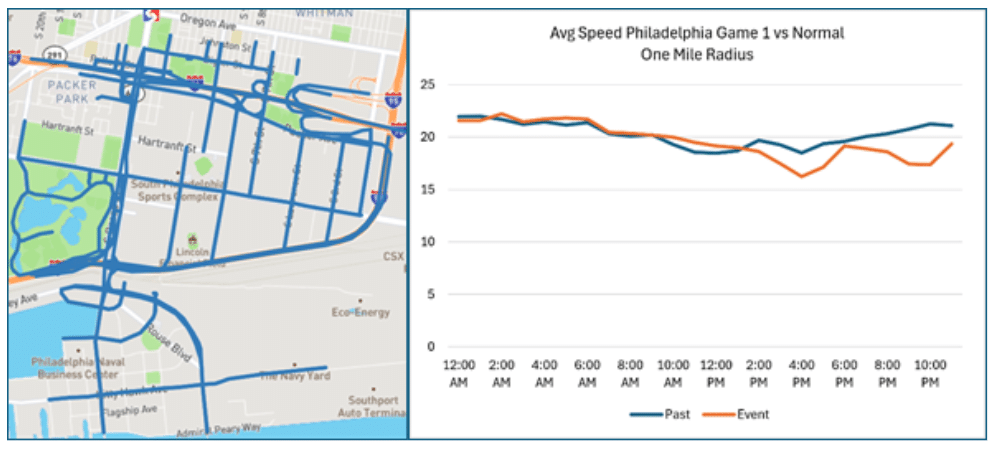
June 14, 2026 – Lincoln Financial Field – Philadelphia, PA – 7:00pm Kickoff
Philadelphia saw less volatility in travel versus normal conditions compared to other FIFA World Cup venues in the United States for game one. Travel speeds within one mile of Lincoln Financial Field fell just 12% versus average Sunday speeds during the 4:00pm and 5:00pm hours. Yet by the 9:00pm and 10:00pm hours, traffic speeds fell to 17.4 mph, or 18% below, typical Sunday night averages.
The first weekend of FIFA World Cup action demonstrated the substantial impact major sporting events can have on local transportation networks. While congestion patterns varied by city, most venues experienced significant slowdowns in the hours leading up to kickoff and immediately following matches as fans departed. MetLife Stadium recorded the most severe pre-game traffic impacts, while other venues such as Lincoln Financial Field experienced comparatively modest disruptions. As the tournament continues and more matches are played across the United States, INRIX will continue monitoring traffic conditions to help transportation agencies, event organizers, media, and travelers better understand and prepare for the mobility challenges associated with this global event.