


By Rick Schuman, VP, Public Sector Americas (rick@inrix.com)
This is the third edition of a weekly review of changes in road traffic demand in the United States from the COVID-19 virus spread and our collective response.[1] We will endeavor to publish this Synopsis every Monday for the foreseeable future, providing results through Friday of the previous week. Note there are a few differences in results from the first two issues as in this Synopsis, a full seven-day weekly averages are now used, versus varying periods in some prior cases. For those interested in detailed information with daily updates, we have introduced the INRIX Traffic Volume Trends Dashboard.
Key Findings
- Travel declined for the 3rd consecutive week, but the week-over-week decline has slowed
- Travel declined from Week 2 across all states and all metropolitan areas for each vehicle type
- Nationally, when compared to typical travel,[2] Week 3 (Saturday March 28 – Friday, April 3) saw:
- Personal travel reduced 47% vs. 42% in Week 2, modestly lower each day of week
- Long haul truck travel reduced 6% vs. 2% in Week 2
- Local area commercial travel reduced 26% vs. 21% in Week 2
- New Jersey experience the largest drop in statewide personal vehicle travel, down 63%
- Michigan experience the largest drop in statewide long haul truck travel, down 31%
- New York City experience largest drop in metropolitan area passenger travel, down 66%
Figure 1
Background
Our incoming data sources (The ‘INRIX Fleet’)– provides anonymous speed/location reporting to us in real-time and generates over 100 million trips, traveling over 1 billion total miles per day across the US. The INRIX Fleet provides information about all roads in the national network, not just major roads and spans the full range of vehicle types: consumer vehicles, local fleets, long haul trucks.
In addition to our real-time speed and congestion information, much of which is being used by the media to document the impact of the virus on travel, our trip data can serve as a proxy for overall road usage trends at national, state, and local levels. We have re-purposed our INRIX Trips metadata – with only a 48-hour lag – to generate relevant summary level information about traffic demand.[3] In this extraordinary time, we hope that this information will be useful to policy makers and the public. We look forward to the week, hopefully soon, when we can report on congestion and volume growth – as this will be a sure sign of recovery.
Synopsis
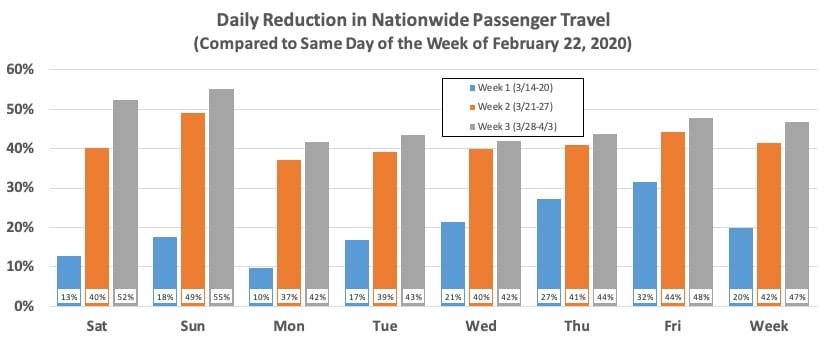
It has been three full weeks since travel began its noticeable decline nationwide. This Synopsis focuses on how this week in total compared to both the previous two weeks along with the control week. Figure 1 details the daily change in passenger vehicle travel since Saturday, March 14, showing the reduction in travel as compared to the control week of February 22, 2020. Figure 1 also includes the overall weekly comparison. For the most recent week, travel was still declining, but the rate of decline slowed since Week 2, with a week-over-week drop of 47% in Week 3, compared to 42% in Week 2.
Table 1 summarizes nationwide average of passenger trip statistics by week. As in Week 1 and 2, the primary reason for total travel decline was the reduction in trips. Week 3 had slightly more than half the total trips of the control week. However, the past two weeks have also seen a reduction in the average trip length, with a 4.5% reduction in Week 3 versus the control week. Note the increase in average trip length in Week 1 was likely due to less urban states with longer average trip lengths changing travel patterns later than the larger/urban states.
| Week | Trip Length (Mi) | Trip Time (Mins) | Travel Speed (MPH) |
| Control Week (2/22 – 29) | 9.11 | 18.44 | 29.6 |
| Week 1 (3/14 – 20) | 9.42 | 17.87 | 31.6 |
| Week 2 (3/21 – 27) | 9.05 | 17.76 | 30.6 |
| Week 3 (3/28 – 4/3) | 8.70 | 17.52 | 29.8 |
Table 1 – Comparison of Average Passenger Vehicle Trip Statistics, Nationwide
Overall travel drops are now significant in every state. Every state had reduced total passenger travel from Week 2. In Week 3, every state had reduced total passenger travel for the week by 36% or more compared to typical, except for Wyoming (27%) and Arkansas (33%). New Jersey has had the largest reduction from the control week of 63%, followed by Hawaii (62%), Michigan (57%) and New York (56%). Six states had more than 10% reductions from typical in Week 3 from Week 2: Montana (15%), Idaho (12%), Minnesota (12%), Colorado (11%), Hawaii (10%) and New Mexico (10%). New Mexico and Alabama showed the least reductions in Week 1, but were at 38% and 37% respectively by Week 3.
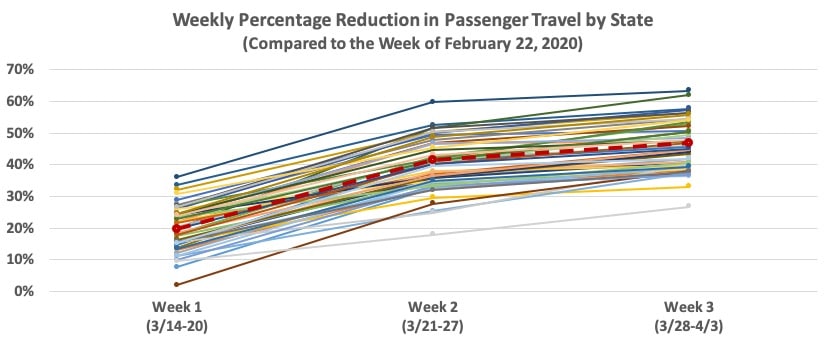
Figure 2, Dotted Red Line is National Average
Nationwide Long Haul Truck travel dropped consistently in Week 3, with all states having a reduction in Week 3 compared to Week 2. Nationwide, travel was down 6% compared to the control week, compared to a 2% reduction in Week 2. Five states (Michigan, Kentucky, North Dakota, Indiana, and Texas) all had reductions from typical exceeding 10% statewide. Michigan had the largest drop at over 31%, more than twice the next largest, Kentucky’s 15%. All of these states have some combination of an international border(s), oil production and a reliance on automobile manufacturing.
Interestingly, while having lower truck traffic Week 3 over Week 2, nine states have not yet turned negative against the control week: Maine, Iowa, Nebraska, Kansas, Idaho, Wyoming, Utah, Nevada, and Oregon. Each of these states is subject to winter weather, so it is possible that in the control week of February 22 – 28 had some inclement weather which artificially lowered the comparison travel week. But all had week over week declines this week, ranging from 0.2% to 3.7%.
Metropolitan Area[4] travel also saw consistent declines in Week 3 from Week 2 for passenger travel, as shown in Figure 3. All 98 metropolitan areas saw reductions from Week 2. In Week 3, total decline ranged from 35% in Augusta, Georgia to 66% in the New York City area. It is interesting to note that in Week 1, the four metropolitan areas with little or no travel declines were all Spring Break destinations: Corpus Christi, Pensacola, Mobile, and Daytona Beach. All have since moved to at least 40% travel reductions in Week 3. The area with the most reduction in travel has shifted from San Francisco in Week 1 (41%) to New York City in Week 2 (60%) and Week 3 (66%).
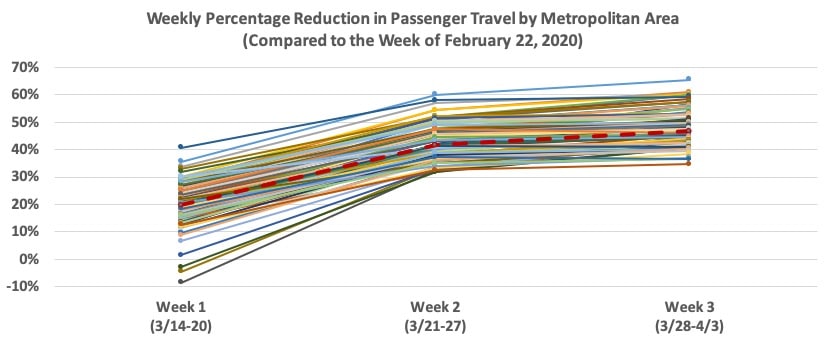
Figure 3, Dotted Red Line is National Average
Figure 3 also shows two notable trends worth watching in future weeks. First, the rate of decline in Week 3 slowed from Week 2. Second, metropolitan areas tend to have declines in travel that exceeded the national average. 53 areas had declines larger than the national average in Week 3, including most higher populated regions. Atlanta is the largest region below the national average, 45% to 47%.
[1] Issue #1 can be found here. Issue #2 can be found here.
[2] Given the day of week pattern of travel demand, we compare a given day and area to the same day/area in a previous week, and we are using the week commencing Saturday, February 22, 2020 as our ‘control week’
[3] Metadata used is total trip distance of all INRIX Trips originating in the country/state/region each day
[4] INRIX has established 98 metropolitan area geographies for internal purposes; these are the areas used in this analysis