


By Rick Schuman, VP, Public Sector Americas (rick@inrix.com)
This is the ninth edition of a weekly review of changes in road traffic demand in the United States from the COVID-19 virus spread and our collective response.[1] We will endeavor to publish this Synopsis every Monday for the foreseeable future, providing results through Friday of the previous week. If interested in detailed information with daily updates, we have introduced the INRIX Trip Trends.
Key Findings
- Travel continued to rebound for the fourth straight week, across all states, regions and vehicle types
- Nationwide personal travel at levels last seen on Saturday, March 21rd
- Nationally, when compared to typical travel,[2] Week 9 (Saturday, May 9 – Friday, May 15) saw:
- Personal travel down 25% vs. 29% in Week 8, increasing daily since April 15th
- Long haul truck travel down 6.1% vs. 7.6% in Week 8
- Local fleets in Metro Areas down 8% vs. 9% in Week 8
- Travel decline leaders in Week 9:
- Statewide Personal Travel: Hawaii, down 51% vs. 53% Week 8, and 62% maximum
- Statewide Long Haul Truck Travel: Michigan, down 29% vs. 32% Week 8, and 38% maximum
- Metro Area Personal Travel: New York City, down 46% vs. 50% Week 8, and 66% maximum
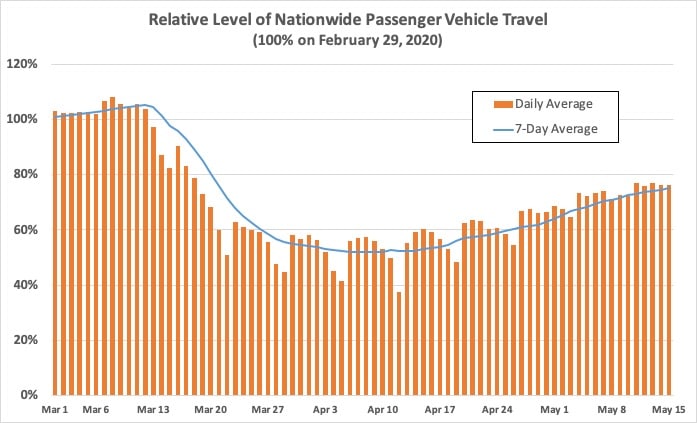
Figure 1
Background
Our incoming data sources (The ‘INRIX Fleet’) provides anonymous speed/location reporting to us in real-time and generates over 100 million trips, traveling over 1 billion total miles per day across the US. The INRIX Fleet provides information about all roads in the national network, not just major roads and spans the full range of vehicle types: consumer vehicles, local fleets, long haul trucks.
We have re-purposed our INRIX Trips metadata – with only a 48-hour lag – to generate relevant summary level information about traffic demand.[3] In this extraordinary time, we hope that this information will be useful to policy makers and the public. We look forward to the week, hopefully soon, when we can report on congestion and volume growth – as this will be a sure sign of recovery.
Synopsis
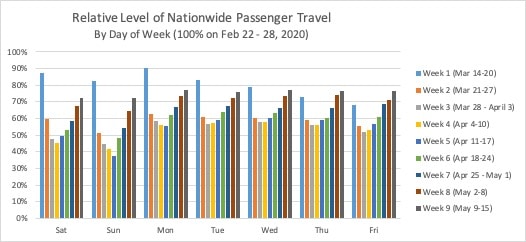
It has been nine weeks since travel began its noticeable decline nationwide. Figure 1 shows the relative change in passenger vehicle travel from March 1, relative to the comparable day of the week during the control week of February 22 – 28, 2020. Figure 1 also includes a weekly rolling average. Passenger travel continued to trend upwards, down 25% weekly on Friday, May 15th, compared to 29% the previous Friday and 48% on April 9th the low point to date. The weekly average was last at 25% on Saturday, March 21th, just eight days into the initial travel decline.
The daily figure for Wednesday, May 13th was 77%, a figure last seen on Wednesday, March 18th. Figure 2 shows the daily figures each week, illustrating the travel declines stabilizing in Weeks 4 and 5, increasing since then. It should be noted that a ‘polar vortex’ hit northern state early in Week 9, likely impacting travel in some states/regions.
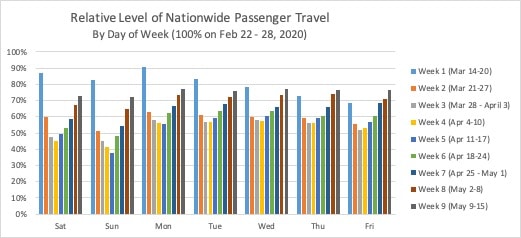
Figure 2
State Level Passenger Travel increased in every state compared to last week, for the fourth week in a row. Four states increased 7%: Alabama, West Virginia, Mississippi, and Washington. Three states increased 1% or less: Vermont, New Hampshire and Maine. 25 states in total increased 5% or more this week. Figure 3 shows each state’s weekly rolling average on May 15th in blue, last week’s (May 8st) in orange, and the maximum drop at any point from March 1st in gray.
All states but Hawaii (11%) have recovered at least 18% from their maximum weekly rolling average reduction, with 13 states recovering 30% or more. Montana has had the largest recovery from its maximum reduction of 37%, from 40% to 3%. Wyoming is the closest to reaching control week travel, down 1% the of end Week 9.
Nationwide Long Haul Truck travel increased in Week 9, down 6.1%, compared to 7.6% last week. 45 states had increased truck travel in Week 9. Five states increased truck travel by 5% or more: Maine (5%), North Dakota (5%), Vermont (4%), Alaska (4%), and Connecticut (4%). Oregon (2%) was the only state to decrease truck travel by more than 1%.
All states have increased from their maximum reduction in truck travel; last week New Mexico and Maine were at maximum reductions. Seven states have overall reductions in truck travel exceeding 10%, compared to 11 states last week, still led by Michigan (29%) and Texas (19%). 15 states, now led by Wyoming, have increased truck travel compared to the control week, up from 14 states last week.
Metropolitan Area[4] personal travel increased overall again this week, with 97 of the 98 metropolitan areas tracked in this Synopsis increasing week over week. The exception was Albany, New York, down 0.5%. 42 areas increased 5% or more week over week, led by Mobile, Alabama, up 12%. Mobile is also the first metropolitan area to fully ‘recover’, now up 1% overall. All other metropolitan area still have declines in personal travel of over 10% compared to the control week. Five areas have declines in the 40%’s (vs. 14 last week), 24 area have declines in the 30%’s (vs. 39 last week), 49 areas have declines in the 20%’s (vs. 40 last week), and 19 areas now have declines in the 10%’s (vs. five last week).
The ten largest reductions in travel in Week 9 were:
-
- New York City: 46%
- San Francisco: 45%
- Miami: 45%
- Orlando: 43%
- Washington, DC: 41%
- Philadelphia: 39%
- Detroit: 39%
- Baltimore: 39%
- Hartford: 38%
- Boston: 38%
Personal travel has increased 15% or more from peak reduction for all 98 metropolitan areas, with 81 areas more than 20% above their peak reduction level. Honolulu now has the least ‘improvement’ at 15% (vs. 13% last week).
Local fleet traffic in metropolitan areas increased in Week 9 overall, down 8%, compared to 9% in Week 8. Four areas increased local fleet traffic week-over-week by 5% or more, led by Lansing, MI at 7%.
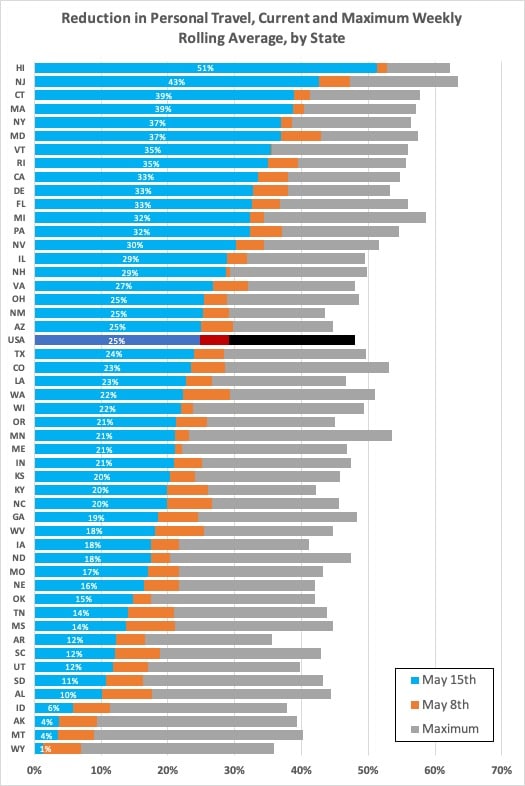
Figure 3
Seasonal Adjustments
According to the Federal Highway Administration, the average daily national vehicle miles traveled in May 2019 was 14.8% higher than the daily average in February 2019.[5] The 25% reduction in nationwide personal travel actually understates the true change in expected travel. In a ‘typical’ year, indices computed in this Synopsis would be expected to naturally rise at/near 15% as our method is not adjusting for seasonal variation.
To simplify, for every 75 miles traveled in the US last week, we could have expected 115 miles if not for the virus. Thus, the 25% reduction translates into a roughly 35% reduction, seasonally adjusted. This calculation is included for illustrative purposes and to remind readers that, depending upon when the indices shown in this Synopsis return to ‘normal’ compared to the Control Week, they may or may not indicate full recovery on a seasonally adjusted basis.
[1] Previous Issues can be found on the INRIX Blog site
[2] Given the day of week pattern of travel demand, we compare a given day and area to the same day/area in a previous week, and we are using the week commencing Saturday, February 22, 2020 as our ‘control week’
[3] Metadata used is total trip distance of all INRIX Trips originating in the country/state/region each day
[4] INRIX has established 98 metropolitan area geographies for internal purposes; these are the areas used in this analysis
[5] https://www.fhwa.dot.gov/policyinformation/travel_monitoring/tvt.cfm