


By Rick Schuman, VP, Public Sector Americas (rick@inrix.com)
This is the 12th edition of a weekly review of changes in road traffic demand in the United States from the COVID-19 virus spread and our collective response.[1] We will endeavor to publish this Synopsis every Monday for the foreseeable future, providing results through Friday of the previous week. If interested in detailed information with daily updates, we have introduced the INRIX Trip Trends.
Key Findings
- Overall travel continued to increase in Week 12, nationwide across all vehicle types
- Nationally, when compared to typical travel,[2] Week 12 (Saturday, May 30 – Friday, June 5) saw:
- Personal travel down 12% vs. 16% in Week 11
- Long haul truck travel down 3% vs. 13.5% in Week 11 (Memorial Day skewed Week 11 low)
- Local fleets in Metro Areas down 2% vs. 18% in Week 11 (Memorial Day skewed Week 11 low)
- Travel decline leaders in Week 12:
- Statewide Personal Travel: Hawaii, down 48% vs. 49% Week 11, and 62% maximum
- Statewide Long Haul Truck Travel: Texas, down 13% vs. 22% Week 11, and 23% maximum
- Metro Area Personal Travel: San Francisco, down 38% vs. 37% Week 11, and 61% maximum
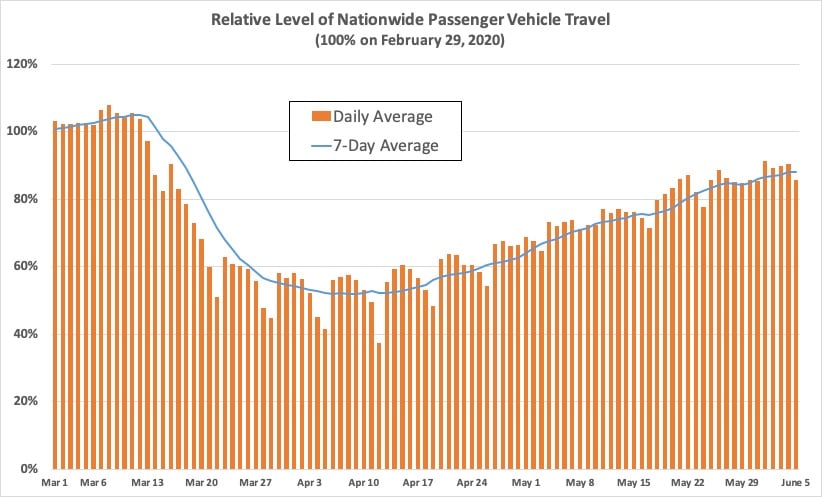
Figure 1
Background
Our incoming data sources (The ‘INRIX Fleet’) provides anonymous speed/location reporting to us in real-time and generates over 100 million trips, traveling over 1 billion total miles per day across the US. The INRIX Fleet provides information about all roads in the national network, not just major roads and spans the full range of vehicle types: consumer vehicles, local fleets, long haul trucks.
We have re-purposed our INRIX Trips metadata – with only a 48-hour lag – to generate relevant summary level information about traffic demand.[3] In this extraordinary time, we hope that this information will be useful to policy makers and the public. We look forward to the week, hopefully soon, when we can report on congestion and volume growth – as this will be a sure sign of recovery.
Synopsis
It has been twelve weeks since travel began its noticeable decline nationwide. Figure 1 shows the relative change in passenger vehicle travel from March 1, relative to the comparable day of the week during the control week of February 22 – 28, 2020. Figure 1 also includes a weekly rolling average. Passenger travel continued to trend upwards, down 12% weekly on Friday, June 5th, compared to 16% the previous Friday and 48% on April 9th the low point to date. The weekly average was last at 12% on Wednesday, March 18th, less than one week into the initial travel decline.
The daily figure for Monday, June 1st was 91%, a figure last seen on Saturday, March 14th, the first day of measurable nationwide travel decline. Figure 2 shows the daily figures each week, illustrating the travel declines stabilizing in Weeks 4 and 5, increasing since then. Memorial Day weekend altered trends, with more travel late in Week 10 and less travel early in Week 11, highlighting that day-to-day trends can be volatile. With no holiday impact, Week 12 reverted to a ‘normal’ week for comparison purposes.
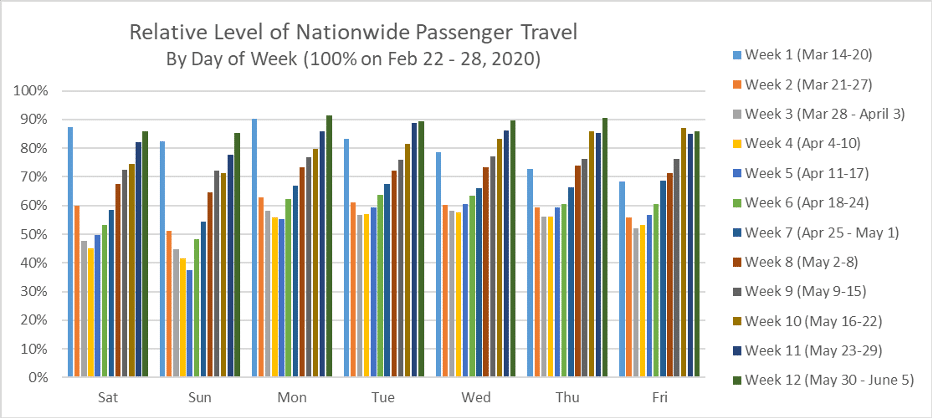
Figure 2
State Level Passenger Travel increased in every state compared to last week, for the seventh week in a row. Table 1 shows Week 12 levels by state, compared to Week 10 so as to avoid holiday week comparisons.
10 states, led by Wyoming, now have personal travel exceeding the Control Week. 6 states – Idaho, South Carolina, Oklahoma, North Dakota, Utah, and Alabama – joined the 4 states that had previously exceeded the control week.
Only Hawaii exceeds a 30% drop in personal travel, with 10 other states at 20% or more. Delaware had the largest change from Week 10 to Week 12 of 14%. Arizona had the smallest change of 2%.
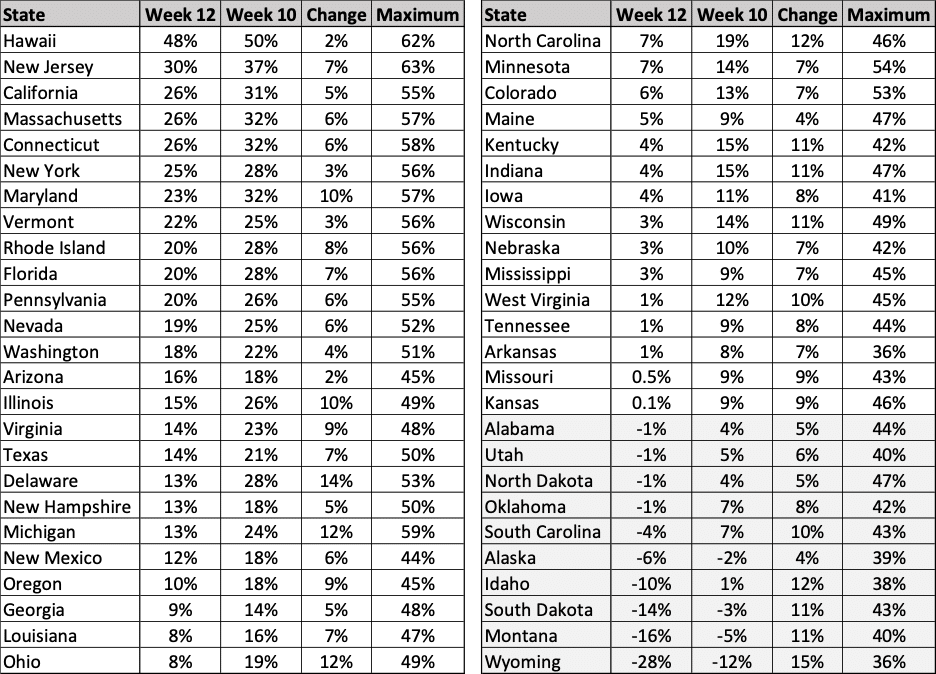
Table 1
Nationwide Long Haul Truck travel increased in Week 12, down 3.0%, compared to a 13.5% drop in Week 11. Week 11 was skewed by Memorial Day, with travel drops on Sunday through Tuesday of the holiday weekend not matching the general trend of recovery. Week 10 was down 4.6%. Figure 3 shows national daily figures each week. On Wednesday June 3rd, total nationwide long haul truck travel reached nearly 100% of the control week, a figure last seen on Sunday, March 29th.
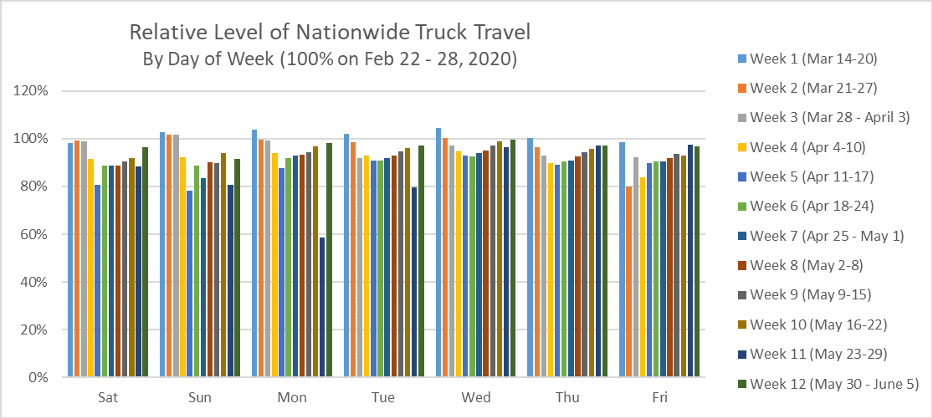
Figure 3
Only three states still had a reduction of 10% of more of long haul truck travel in Week 12, Texas (13%), New Mexico (13%) and Arkansas (10%). Michigan, which for several weeks had been the most severely impacted state, was down 8% in total in Week 12, from 26% in Week 10. 23 states had increased truck travel from the Control Week.
Metropolitan Area[4] personal travel increased overall again this week, with 89 of the 98 metropolitan areas tracked increasing in Week 12. Only three gulf coast areas led by Corpus Christi, Texas, had drops of more than 1%, presumably since Week 11 was skewed in those areas due to holiday traffic increases. Six areas have now fully ‘recovered’: Mobile, Pensacola, Knoxville, Wichita, Toledo, and Corpus Christi.
The ten largest reductions in travel in Week 11 were:
-
- San Francisco: 38% (37% last week)
- New York City: 35% (40% last week)
- Miami: 34% (40% last week)
- Orlando: 34% (36% last week)
- Honolulu: 32% (33% last week)
- Washington, DC: 30% (35% last week)
- Los Angeles: 29% (28% last week)
- Fort Myers: 29% (31% last week)
- Philadelphia: 28% (34% last week)
- San Diego: 28% (30% last week)
Personal travel has increased 20% or more from peak reduction for all 98 metropolitan areas, with 96 areas more than 25% above their peak reduction level. Honolulu now has the least ‘improvement’ at 20% (vs. 19% last week).
Local fleet traffic in metropolitan areas increased in Week 12 overall, down 2%, compared to down 18% in Week 11 (skewed by Memorial Day Weekend), and 6% in Week 10.
Seasonal Adjustments
According to the Federal Highway Administration, the average daily national vehicle miles traveled in June 2019 was 16.5% higher than the daily average in February 2019.[5] The 12% reduction in nationwide personal travel actually understates the true change in expected travel. In a ‘typical’ year, indices computed in this Synopsis would be expected to naturally rise at/near 16-17% as our method is not presently adjusting for seasonal variation.
To simplify, for every 88 miles traveled in the US last week, we could have expected 116.5 miles if not for the virus. Thus, the 12% reduction translates into a roughly 25% reduction, seasonally adjusted. This calculation is included for illustrative purposes and to remind readers that, depending upon when the indices shown in this Synopsis return to ‘normal’ compared to the Control Week, they may or may not indicate full recovery on a seasonally adjusted basis.
INRIX Trip Trends Dashboard Chart of the Week
Each week going forward, the Synopsis will include a chart from the INRIX Trip Trends Dashboard, a service available for licensing. Figure 4 shows the trends in daily passenger travel for the US (red), the Washington, DC metropolitan area (yellow), and the District of Columbia proper (green).
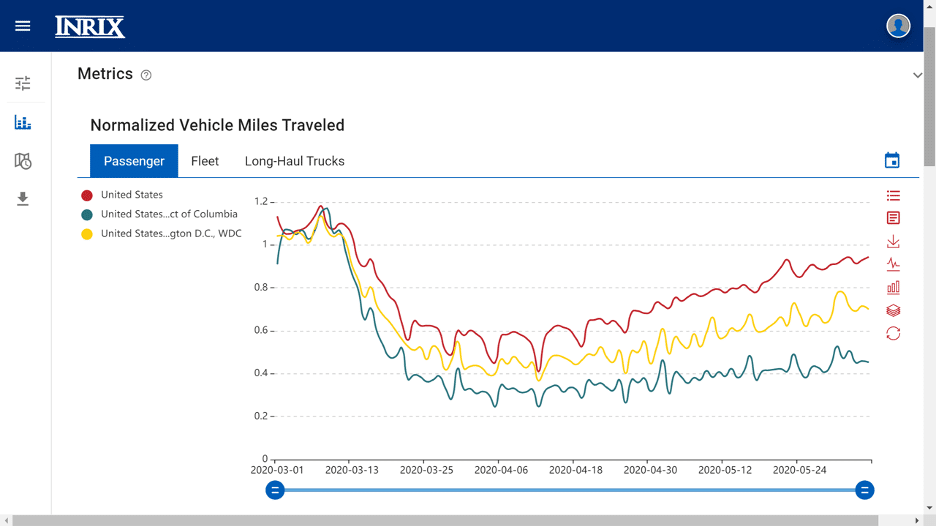
Figure 4
[1] Previous Issues can be found on the INRIX Blog site
[2] Given the day of week pattern of travel demand, we compare a given day and area to the same day/area in a previous week, and we are using the week commencing Saturday, February 22, 2020 as our ‘control week’
[3] Metadata used is total trip distance of all INRIX Trips originating in the country/state/region each day
[4] INRIX has established 98 metropolitan area geographies for internal purposes; these are the areas used in this analysis
[5] https://www.fhwa.dot.gov/policyinformation/travel_monitoring/tvt.cfm